Forum Replies Created
-
AuthorPosts
-
support
KeymasterHi,
No problem. According to our records, you already have the Custom edition, so you should be able to use the post-build commands. Please refer to the screenshot below:
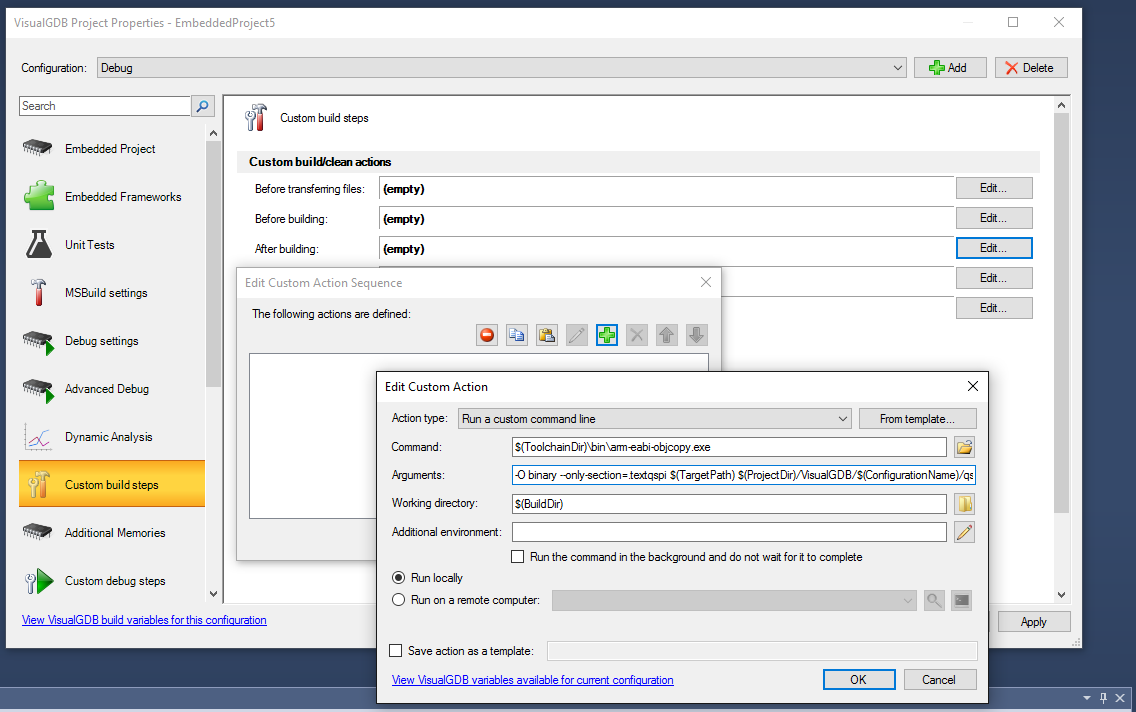
Please select VisualGDB Project Properties -> Custom Build Steps -> Actions after building -> Edit -> Add -> Run a custom command line.
Then locate the objcopy binary from your toolchain and enter the arguments with the adjusted input and output file paths. We recommend using variables like $(TargetPath) and $(ProjectDir) to avoid hardcoding the paths. The objcopy command will read the input ELF file (first argument after –only-section), locate the .textqspi section inside it and dump it into a .bin file (second argument after –only-section). Please ensure that the input file path matches the path of the ELF file built by your project so that objcopy can process it correctly.
Attachments:
You must be logged in to view attached files.KeymasterHi,
We are sorry about your experience. We have just retested this by creating a new project for Nordic nRF528232 with the SDK 13.0 and manually enabling the power module and could not get any error. The line mentioning NRF_POWER_THRESHOLD_V23 compile successfully and IntelliSense is able to find the definition correctly.
Perhaps you have imported the project in a way that lets a 3rd-party Makefile control the build and the Makefile itself contains errors? We would be happy to help you if you could let us know how exactly have you created the project so that we could reproduce this on our side.
KeymasterHi,
Yes, this Makefile saves the contents of the ExtFlashSection to extflash.bin. If you want to convert the project into a MSBuild-based VisualGDB project, you would need to add the objcopy command to the custom post-build actions to achieve the same result.
KeymasterHi,
If you want to generate a project with 2-way synchronization, we recommend using MSBuild (the first option). However please note that it will not automatically import all of the settings like preprocessor macros, so you would need to specify them manually after importing.
KeymasterHi,
It looks like the MSI file is corrupt. Please try re-downloading it and ensure that you have administrator permissions on that machine (and that your antivirus is not accidentally blocking access to the MSI file).
KeymasterHi,
Thanks for clarifying this. We have replied with further details to the support ticket you opened.
KeymasterHi,
No problem. If you encounter any issues, feel free to post here and we will help.
KeymasterHi,
Please try searching the header files in the Nordic SDK directory for the definitions of NRF_POWER_THRESHOLD_V25. E.g. in SDK 13.0 it is defined in nrf_soc.h, but only if SOFTDEVICE_PRESENT is defined as well. Hence you would need to ensure that the softdevice is enabled for your project.
KeymasterHi,
Are you installing the latest VisualGDB 5.2R9 (or 5.3)? The installer should normally create the “C:\Program Files (x86)\MSBuild\Microsoft.Cpp\v4.0\Platforms\VisualGDB” folder with 6 files inside it. Is the folder created? If not, please try running msiexec /l* visualgdb.log /i VisualGDB-<version>.msi and then submit the log file here so that we could check why the MSBuild platform is not installed.
KeymasterHi,
You can add it to the custom post-build commands in VisualGDB Project Properties (requires Custom Edition and higher).
KeymasterHi,
The “flash bank name ‘stm32f4x.flash’ already exists” error means that the FLASH name you specify is already used by the default FLASH memory bank. Simply change $_FLASHNAME to any arbitrary name (e.g. qspi). The bank name does not refer to a specific driver, instead it defines a unique name for the newly created bank.
The “Failed to connect to the debug stub” message means that GDB could not connect to OpenOCD (most likely because OpenOCD exited with an error). Please examine the OpenOCD window (or the GDBServer log in the VisualGDB error detail window) for details.
August 3, 2017 at 06:40 in reply to: FreeRTOS compile error: instruction not allowed in IT block — 'msr psp, r0'… #11889KeymasterHi,
Most likely the FreeRTOS port file you are using is not compatible with your CPU core and floating point mode. Please try changing FreeRTOS port via VisualGDB Project Properties -> Embedded Frameworks (or manually selecting a port.c file from a different folder if you are not referencing FreeRTOS via VisualGDB framework mechanism).
KeymasterHi,
If you already have a Makefile for the GCC compiler, you can simply select “import a project built with command line tools” in the VisualGDB project wizard and it will create a wrapper project that will invoke GNU Make to build it. It won’t have a 2-way synchronization between the settings in the Makefile (e.g. list of source files) and the Visual Studio project, but would be extremely easy start with.
Another approach would be to extract the list of source files and the build settings (like header search paths) from the Makefile and manually enter it into a VisualGDB project (we recommend using creatinga new MSBuild-based project for your device to begin with). This requires a bit extra effort, but would get a 100% integrated development experience (e.g. adding a new preprocessor macro or changing optimization level would immediately take effect for both IntelliSense and build).
If you encounter any problems along the way, feel free to post the details here and we will help.
KeymasterHi,
The mechanism used in the tutorial would work for any compiler that produces ELF files that can be debugged by gdb (ARM Clang V6 is compatible). However the specific steps (e.g. the exact compiler arguments or the linking order) could be different.
We currently don’t have an out-of-the-box tutorial for the ARM Clang compiler, so we would advise trying to follow the regular Keil tutorial and making the necessary changes to account for the different compiler. If you encounter any difficulties along the way, feel free to post the details here and we will help you resolve any issues you encounter.
KeymasterHi,
This looks like a corrupt VisualGDB installation. Please try uninstalling it and reinstalling it back.
-
AuthorPosts