Forum Replies Created
-
AuthorPosts
-
support
KeymasterHi,
It looks like your trial has expired. In order to keep on receiving technical support please purchase a license. If you have already purchased a license under a different email, please let us know and we will update our records.
KeymasterHi,
Looks like your toolchain installation might have gotten corrupt (mixed old/new headers). Please try deleting it and doing a clean install (VisualGDB 5.3 deletes the old toolchain directory when updating, however VisualGDB 5.2 does not).
The latest toolchain does include the “ftdi/esp32_devkitj_v1.cfg” file. Please ensure that your settings look like shown below:
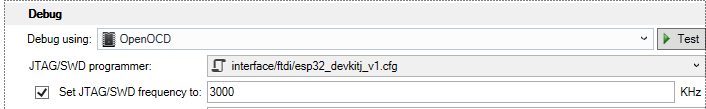
Attachments:
You must be logged in to view attached files.KeymasterHi,
Thanks for checking this. We were not aware of it and it looks like something specific to the msp430 gdb and the device you are using. The only side effect of this would be that the ‘step into new instance’ command (or pressing F10 instead of F5) will not work. Other features should not be affected by this.
P.S. You can also disable the breakpoint in ‘main’ by unchecking the checkbox shown below on the Advanced GDB Settings page of VisualGDB Project Properties:

Attachments:
You must be logged in to view attached files.KeymasterHi,
Sorry for the confusion. The new toolchains based on ESP-IDF 2.0 and later are only compatible with VisualGDB 5.3 (we had to add a few workarounds in order to support the new Cygwin-based build system). VisualGDB 5.2 should not even show those toolchains in the download list, however if you installed them via v5.3 and then downgraded to v5.2, this would cause multiple weird problems.
Using an older toolchain with a new ESP-IDF would not work either as Espressif changed the clock initialization sequence in the new bootloader that causes the old FLASH programming code to hang.
Hence please try updating to VisualGDB 5.3 and the latest ESP32 toolchain and let us know if you still experience any troubles so that we could help you.
KeymasterHi,
Having 2 separate sets of flags would unfortunately overcomplicate the VS property pages for MSBuild projects, so instead we have the same flags, but automatically filter out options like -fno-exceptions and also allow specifying C/C++ standards separately (use the VS project properties for that).
If you are trying to specify some other option that is only supported on C (or C++) files, let us know and we will add it to the VS property pages for MSBuild projects (unless this is something very rarely used in which case you can simply add a custom target to your project for adding those options similar to RemoveIncompatibleCompilerSwitches).
KeymasterHi,
Sorry, unfortunately checking exact configurations against board schematics goes beyond the scope of our technical support, however we can point you to the most likely cause of the problem.
The following line from the error log suggests that the order of scripts and initialization commands might be wrong:
Error: The 'mww' command must be used after 'init'.
Please try starting with the default settings for ESP32 debugging, ensure that you get a different error (e.g. ‘all bits are zero or one’) and then try modifying the ftdi configuration file to specify your layout.
We have also recently received the ESP-WROOM-32 module (not the WROVER board though) and will be publishing a tutorial showing how to program it over JTAG with Olimex ARM-USB-OCD-H in the next few weeks. You could simply wait till we publish that tutorial and use the schematics from it as a reference.
KeymasterHi,
No problem, we can walk you through pinpointing and resolving this. First of all, please ensure that you are using exactly the same version of msp430.dll and msp430-gdbproxy both in command-line mode and from VisualGDB.
If both versions are the same, most likely the slow behavior is caused by some command-line argument or gdb command. Please try enabling advanced gdb logging via VisualGDB Project Properties -> Advanced GDB Settings. This will create a .log file with all gdb commands issued by VisualGDB as a part of your debug session. Then please try running gdb/gdbproxy manually with the commands shown by VisualGDB and run the same commands (you can skip commands for evaluating sizeof(void *) and other built-in types).
Can you reproduce the slow behavior by running the commands manually? If yes, please try removing some of them to see which of them causes the slowness. If no, what happens if you launch gdbproxy manually and change GDB settings on the Debug Settings page of VisualGDB Project Properties to “manual mode” and explicitly specify the “target remote :<port>” command? If this works faster, some environment variable that is only present when launching from VS might be affecting the msp430.dll behavior.
KeymasterHi,
Currently there is no special way of deleting the folder without using the VS functionality, although it looks like a good idea and we will try to add it in the next version. If you experience different timings with VS IntelliSense and Clang IntelliSense, we might be able to help you find a workaround. Can you confirm that deleting the same files on the same project takes >2x more time with Clang IntelliSense enabled?
KeymasterHi,
Are you using VisualGDB 5.2? The new ESP32 toolchain is only compatible with v5.3 and v5.2 would suggest downgrading back to the last version that is compatible with v5.2.
KeymasterHi,
Thanks for confirming this. Visual Studio only queries the underlying debugger for an expression if it looks like a valid C/C++ identifier, so ‘(‘, and other operators are not automatically queried. We might be able to override this in one of the future VisualGDB versions via installing a special hook, however we would not do this in v5.3 as the same mechanism is used for ctrl+arrow navigation and we want to avoid breaking it.
September 23, 2017 at 05:17 in reply to: Guide for getting VisualGDB MSBuild to work on a build agent? #12481KeymasterHi,
Sorry for the delay. We will be able to investigate this in more detail next week after releasing v5.3 RC1. The problem happens because TFS is using a different assembly search path than the regular VS and cannot load the VisualGDB assembly.
Our best advice would be to try different TFS settings related to assembly search path (e.g. see this post) to ensure the build agent can locate the VisualGDB assembly.
KeymasterHi,
It looks like VisualGDB is trying to add some file to the project and this triggers an internal exception in VS. Please try updating to VisualGDB 5.3 Preview 8 and check if the problem persists. If yes, please attach an updated stack trace so that we could help you pinpoint this.
KeymasterHi,
The easiest way to do it would be to close VS and remove the old toolchain directory. The latest VisualGDB 5.3 Preview and the latest ESP32 toolchain include a fix that prevents VisualGDB from keeping any files in the toolchain directory open, so it should not be a problem next time you update.
KeymasterHi,
OK, we have investigated this and unfortunately it looks like the debug popup handling for ‘(‘ is hardcoded inside the Visual Studio logic with no reliable way to work around it without negative side effects. So unfortunately we won’t be adding this functionality to the final v5.3, sorry.
KeymasterHi,
Thanks, we have retested this and could only measure a 12% slowdown compared to regular VS IntelliSense. Please ensure that you are deleting the same amount of files with the same layout in both cases. If yes, can you reproduce it on a test project with 1000 generated files? If yes, please send it to us and we will investigate.
-
AuthorPosts