Forum Replies Created
-
AuthorPosts
-
support
KeymasterHi,
For a stand-alone project please simply remove “compactcpp” from the list of libraries in the first page of VisualGDB Project properties.
KeymasterHi,
Wow, this looks like something in the installation/configuration gone horribly wrong. We have just re-tested a clean R7 toolchain install, but could not reproduce any crashes. The OpenOCD output also mentions a different build date:
C:\SysGCC\esp32\esp32-bsp\OpenOCD\bin\openocd.exe -c "gdb_port 8786" -c "telnet_port 8787" -f interface/ftdi/olimex-arm-usb-ocd-h.cfg -c "adapter_khz 3000" -f target/esp32.cfg -c "echo VisualGDB_OpenOCD_Ready"
Open On-Chip Debugger 0.9.0 (2017-08-05)
Licensed under GNU GPL v2
For bug reports, read
    http://openocd.org/doc/doxygen/bugs.html
adapter speed: 3000 kHz
Info : auto-selecting first available session transport "jtag". To override use 'transport select <transport>'.
force hard breakpoints
VisualGDB_OpenOCD_Ready
Error: libusb_open() failed with LIBUSB_ERROR_NOT_SUPPORTED
Info : clock speed 3000 kHz
Info : JTAG tap: esp32.cpu0 tap/device found: 0x120034e5 (mfg: 0x272 (Tensilica), part: 0x2003, ver: 0x1)
Info : JTAG tap: esp32.cpu1 tap/device found: 0x120034e5 (mfg: 0x272 (Tensilica), part: 0x2003, ver: 0x1)
Info : Target halted. PRO_CPU: PC=0x400D0A58 (active)    APP_CPU: PC=0x00000000
Info : accepting 'gdb' connection on tcp/8786
Info : Use core0 of target 'esp32'
Info : Target halted. PRO_CPU: PC=0x40090FA3 (active)    APP_CPU: PC=0x400803C0
Info : Auto-detected flash size 4096 KB
Info : Using flash size 4096 KB
Info : dropped 'gdb' connection
It looks like you might have accidentally started an incorrect version of OpenOCD (or accidentally copied it over the version in the R7 toolchain). Our best advice would be to delete the toolchain directory and try installing it again. Please also ensure you are using the latest VisualGDB 5.3R5 (early pre-release v5.3 builds are not compatible with the latest toolchains).
KeymasterHi,
It looks like when you go to the new line with VisualGDB, it inserts double indentation, so the logic that is supposed to remove it when ‘{‘ is typed, only removes a half of it.
It also looks like some other VS extension is highlighting the indentation in red color; perhaps the same extension is responsible for inserting extra spaces?
We have also added extra logging to this build: http://sysprogs.com/files/tmp/VisualGDB-5.3.15.1912.msi
Please try re-running the case shown on Working2.gif and post the output of View->Clang IntelliSense Diagnostics Console here. It will explain what is going on.
KeymasterHi,
This happens because the newer gcc includes optimizations that make the libcompactcpp library unnecessary, so it was removed from the latest release. Please try opening VisualGDB Project Properties and clicking the regenerate button (it it’s not shown, try changing any of the MCU-related settings and restoring it back). This should rebuild all toolchain-specific settings and remove the references to the missing library.
KeymasterHi,
The behavior you are describing could be caused by several different factors:
- USB virtualization slowing down communication with the JTAG probe
- Some very frequently called functions being configured for monitoring, overloading the communication channel
- Unexpected RTOS modifications that cause internal state corruption (real-time watch only supports FreeRTOS currently)
The easiest way to diagnose this would be if you could make a short video showing:
- Your debug settings
- The slowly updating output you mentioned
- Several seconds of the live profiling window (including the ‘statistics’ view)
- Call stack and the context (e.g. the value of s_FastSemihostingState)
This should help us quickly understand what is going on and suggest a fix. If you don’t want to make the video public, you can simply send it via our support form.
Another approach would be to try running the analysis on a “LEDBlink” project and if works normally, start comparing/eliminating the differences between the 2 projects (e.g. switch to use same RTOS, same main() function, etc).
KeymasterHi,
Olimex recommends using the open-source avrdude program with AVR-ISP500. VisualGDB currently doesn’t support it out-of-the-box, so you would need to install and configure it manually. If you can confirm that the command-line programming with avrdude works, we can help you configure your VisualGDB project to run it automatically.
It could be also worth a try checking if the AVaRICE tool shipped with our AVR toolchain can recognize AVRISP MKII. If yes, you would not need to install any extra tools.
KeymasterHi,
Thanks for the exported settings. We have tried loading your settings into our VS2017 test setup, however we could not get the behavior you are demonstrating.
The incorrect formatting could be caused by interference from other plugins. Please try disabling all other extensions via Tools->Extensions and Updates and let us know if you locate a specific extension that causes this. If nothing helps, please try exporting all your Visual Studio settings and then resetting them to defaults.
KeymasterHi,
Sorry, it is hard to guess what is going on without knowing further details. Please try reproducing this on a smaller project and sending it to us so that we could examine it.
If the problem only happens on a larger project, please try comparing the settings between the 2 projects:
- .vgdbsettings files
- .vcxproj files (e.g. manually defined macros)
- sets of included headers
KeymasterHi,
Sorry for the confusion. We will try to explain how VisualGDB manages IntelliSense headers.
When you create your first project built on a remote Linux machine, VisualGDB creates a local Windows cache of the related header directories, so IntelliSense can parse them automatically. If you later install more packages to your Linux system, the headers installed by them won’t automatically be downloaded, leading in the error you are describing: the code would build, but IntelliSense would not find headers.
This could be fixed by letting VisualGDB rebuild the header directory cache. The exact wording of the command depends on your VisualGDB version and the project type, but the option is located on the IntelliSense Directories page of VisualGDB Project Properties (e.g. ‘Reload all directories’). If you are not sure, please attach a screenshot of that page and we will help you find the correct settings.
KeymasterThanks for trying it and sorry for the inconvenience. VisualGDB might be picking up the setting that causes this from the regular VC++ formatting settings.
Please try exporting them via Tools->Import and Export Settings -> Options->Text Editor->C/C++ and attach them here (or send them via our support page) so that we could try reproducing it on our side.
Another option would be to try exporting all settings and then resetting them. If this helps, please try exporting the settings after reset and comparing the produced files. This should show which settings were different and what setting was causing this.
KeymasterHi,
Please try synchronizing the header directories (via IntelliSense Settings page of VisualGDB Project Properties). This will ensure VisualGDB has access to the latest versions of all headers.
You can also try creating an advanced CMake project (requires VisualGDB 5.3) that will access the remote filesystem directly over SSH; this will eliminate the need to synchronize any headers or source files.
KeymasterHi,
You could work around this with a relatively simple hack: create a file called cplusplus.h in your project directory with the following contents:
#pragma once

#ifdef __cplusplus
    #undef __cplusplus
    #define __cplusplus <value>
#endif
then add the following code to your .vcxproj file:
  <ItemDefinitionGroup Condition="'$(DesignTimeBuild)' == 'true'">
    <ClCompile>
        <ForcedIncludeFiles>%(ClCompiler.ForcedIncludeFiles);cplusplus.h</ForcedIncludeFiles>
    </ClCompile>
  </ItemDefinitionGroup>
This will override the __cplusplus value used by IntelliSense, but won’t affect the actual build.
BTW, feel free to let us know the reasons you don’t like Clang IntelliSense. We are constantly improving it and adding new usability features, so we always appreciate feedback on making it even better.
KeymasterHi,
We understand your frustration with this, however it’s hard to guess what is going on based on the scarce puzzle pieces you provide. The behavior you are describing would be consistent with the ‘unix’ macro simply not being defined (which is the expected behavior for certain types of projects).
We would love to help you, but in order to do that, we need to understand your scenario and what you are trying to accomplish. So please provide the following information so that we can help you:
- The exact steps to create the project (project type/toolchain/etc)
- The steps to reproduce the problem, including the expected outcome and the observed outcome
- A screenshot of the entire VS window showing the problem (often minor details like file names or the navigation bar provide important clues).
E.g. in our experiments the #ifdef unix looks like this:
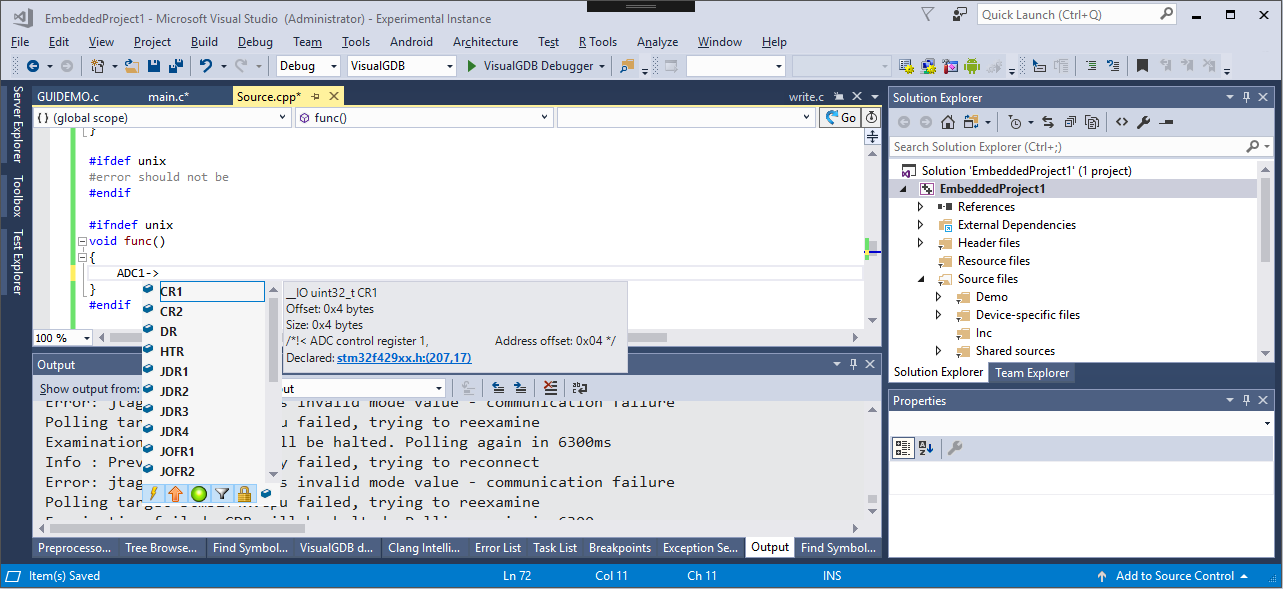
The macro is not defined (and should not be for this project type), so the code inside #ifdef is grayed out and the code inside #ifndef is working as expected.
-
This reply was modified 8 years, 5 months ago by
support.
Attachments:
You must be logged in to view attached files.KeymasterHi,
We understand your frustration and agree that this is important, so we will try to give more context on this.
There are 2 popular low-level debug tools for modern ARM devices: OpenOCD and Segger J-Link.
- OpenOCD is free and works with many inexpensive debug probes like ST-Link, however it has some glitches and is not as user-friendly.
- Segger J-Link software requires a more expensive J-Link probe, but its low-level gdb stub is fully supported by the probe manufacturer, explicitly tested with many devices and is generally much more reliable.
With VisualGDB we don’t aim to replace any of those 2 low-level methods. Instead we build on top of them, focusing on usability features like easy project configuration, profiler, real-time watch, live variables, etc. We also provide easy setup GUI for OpenOCD that automatically detects and configures common setups, but this approach still inherits various glitches for advanced scenarios like the one you are encountering. We could address it by making a “bulletproof” fork of OpenOCD, however making it as reliable as J-Link would raise the product costs accordingly. Instead of doing that, we maintain out-of-the-box support for both debug methods and let our users choose between more reliable J-Link and free OpenOCD.
Hopefully this explains.
Thanks.
KeymasterHi,
No problem, we have submitted a ticket to the OpenOCD bugtracker: https://sourceforge.net/p/openocd/tickets/165/
-
AuthorPosts