Forum Replies Created
-
AuthorPosts
-
support
KeymasterHi,
Sorry, it doesn’t look like any known issue. Most likely, some file somewhere got corrupt and is interfering with IntelliSense.
Our best advice would be to reset the environment (toolchain, ESP-IDF) and try creating a new project from scratch. If the problem doesn’t reappear on the new project, try comparing the project files between the working and non-working projects to pinpoint the setting that could be causing this.
February 13, 2024 at 19:03 in reply to: Is there a tutorial how to use "Include What You Use (ICWYU)" ? #35331KeymasterHi,
This is really something to check with the ICWYU developers. If they are willing to make it compatible, we can provide a public interface for their extension to query the VisualGDB project structure (it’s actually rather straight-forward on our side – just a list of files and corresponding Clang flags) and help them get it working. If not, it’s really not up to us, sorry.
February 12, 2024 at 18:05 in reply to: Defining pre build command to build one file each time #35325KeymasterHi,
You can configure custom pre-build steps via VisualGDB Project Properties -> Custom Build Steps.
As for the command line, it’s something for you to figure out. VisualGDB can run arbitrary command lines at different times during the build as configured via VisualGDB Project Properties, but it’s up to the user to make sure these command lines make sense and work as expected.
February 10, 2024 at 13:14 in reply to: Defining pre build command to build one file each time #35323KeymasterHi,
There isn’t any specific setting that would do that directly, but you could try adding a pre-build step that would regenerate some header file, and including that file from all sources that you would like to be rebuilt.
KeymasterHi,
Sorry, we do not have any plans for updating the RISC-V toolchain at this point. Feel free to build one manually from sources.
KeymasterHi,
Sorry for the delay. We have updated our STM32MP1 toolchain to the latest openstlinux-6.1-yocto-mickledore-mp1-v23.11.15 release.
We have not explicitly tested it on STM32MP13, however we did compare the Linux-based toolchains produced by the ST build scripts for stm32mp1 vs stm32mp13-disco targets and they looked pretty identical (sysroots/device trees are different though).
You should be able to target STM32MP1 devices with the new toolchain, as long as you replace its sysroot with the one from your current Linux-based toolchain (cortexa7t2hf-neon-vfpv4-ostl-linux-gnueabi subdirectory). You can also try using the original sysroot: as long as you are not building any kernel modules with it (that is not possible anyway), there’s a high chance it will work just fine.
KeymasterHi,
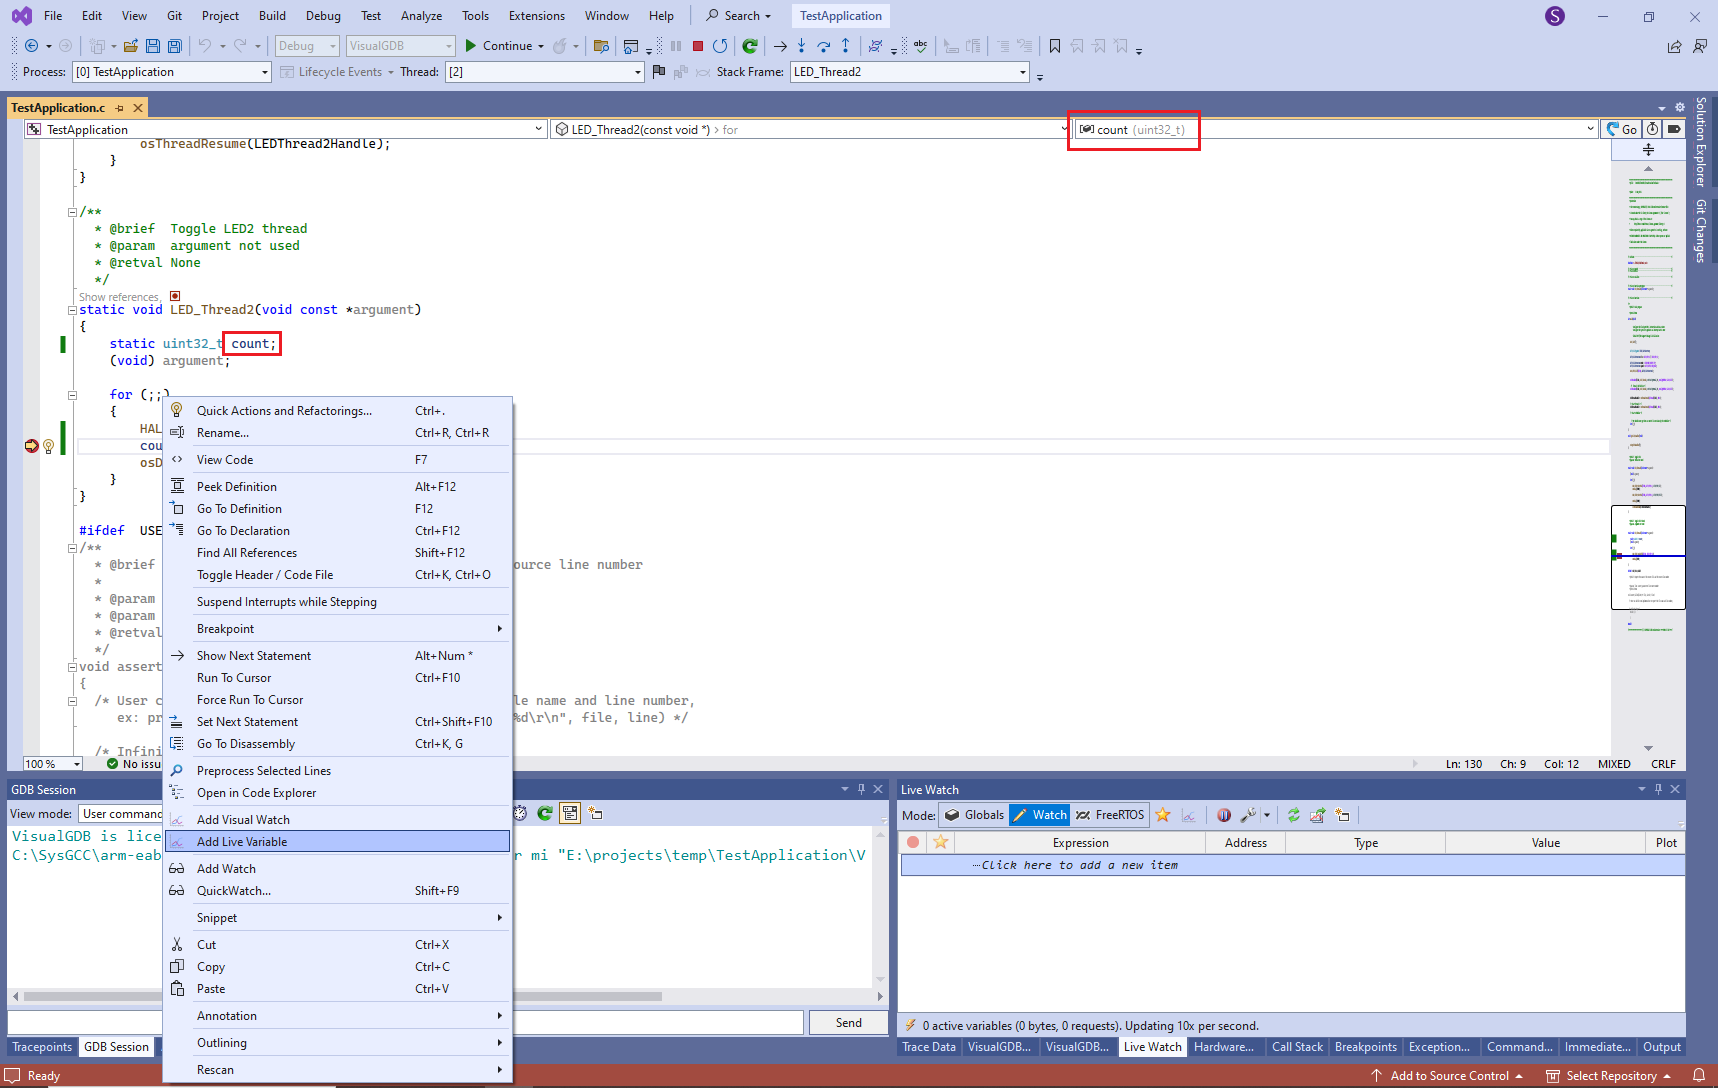
It should work just fine, as long as the debug session is running, Live Watch is enabled, and VisualGDB understands the context of the variable (top right corner of the navigation bar).
If not, feel free to share a screenshot demonstrating the problem, and we’ll look into it.
That said, you can also switch Live Watch to globals view and enable the “Current file only” mode to quickly see all variables in the current file, and flag the important ones as favourites.
Attachments:
You must be logged in to view attached files.January 23, 2024 at 15:44 in reply to: Linker file changes to default when cube project is reloaded #35292KeymasterHi,
Thanks, we have reproduced and fixed the issue. Please try this build: VisualGDB-6.0.4.5100.msi
KeymasterHi,
Based on what we see, we do have traffic from Estonia, so it looks like some glitch on your side or with your ISP, sorry.
KeymasterSorry, it looks like a network issue on your side. Please contact your system administrator for help.
KeymasterHi,
This error means that something on your computer is preventing VisualGDB from accessing Internet and downloading the packages. Please double-check your firewall/proxy settings and make sure VisualGDB can connect.
KeymasterHi,
If you believe another IDE works better, you can do a very simple experiment:
- Create/open a similar ESP-IDF-based project with another IDE
- Get the library working there
- See what exact changes to CMakeLists.txt that other IDE did
- Port those changes to your VisualGDB-based project
But, realistically, IDE settings come from the underlying project types, so as long as you keep using ESP-IDF, the settings will look very similar in any IDE, and will translate to the same ESP-IDF parameters.
In general, we try to be as transparent as possible with the scope of our technical support. VisualGDB can save you time by automating common routine tasks, but it cannot replace the knowledge and understanding of the underlying frameworks and technologies. If you find ESP-IDF too complex, you can try another device or framework, but it’s up to you to study it sufficiently.
KeymasterHi,
For ESP-IDF projects, VisualGDB merely provides a GUI for editing common ESP-IDF statements. If you need help with finding a particular setting, please first refer to the ESP-IDF documentation so that you will know what exact ESP-IDF statement you will need to modify, and in which way. Once you confirm that it works, we can help you find a VisualGDB setting that corresponds to it.
KeymasterHi,
You can try dumping the build command into a batch file as shown here. It will contain all the necessary environment variables, so you can then modify it to run idf.py or any other command.
KeymasterHi,
We have not recreated the tutorial because there have not been any major changes to the ESP-ADF workflow. We had added a note in step 4 here explaining how to find out the toolchain version compatible with ESP-ADF and a separate section here, explaining how ESP-ADF and ESP-IDF work together.
The compatibility between specific versions of ESP-ADF, ESP-IDF, the toolchains and Python is up to Espressif. All we do is briefly retest the stable ESP-IDF releases with the corresponding toolchains, and release them as ready-to-install packages. ESP-ADF has considerably fewer users than ESP-IDF, so we do not retest it that often, sorry.
If you are running into strange problems with ESP-ADF and Python, we would suggest troubleshooting it as follows:
- Reset your Python environment as described here.
- Find out the exact versions of ESP-IDF, ESP-ADF and the toolchain you want to use (per Espressif documentation).
- Install the corresponding toolchain via VisualGDB Package Manager.
- Install ESP-ADF into that toolchain as shown here.
If it still doesn’t work, you could be still using incompatible versions of Espressif packages. We would advise first getting it to work outside VisualGDB, then taking note of the exact versions that actually work, and double-checking that VisualGDB is using the same versions. You can always export the build command used by VisualGDB to a batch file as shown here, and experiment with it (e.g. patch it to use a different Python environment, or a different ESP-IDF version).
As far as our support goes, we can help you find VisualGDB settings that control specific parts of the build (e.g. which ESP-ADF version is used by a specific project), but it’s up to you to find a working combination of parts provided by Espressif.
-
AuthorPosts