Forum Replies Created
-
AuthorPosts
-
support
KeymasterHi,
The conflicts between files would likely be caused by VisualGDB referencing its own frameworks (e.g. STM32 HAL). If you are using the latest VisualGDB 5.3 with the new automatic STM32CubeMX importer as described here, it should not happen. If it does, could you please upload the project generated by STM32CubeMX and the project imported by VisualGDB and post a link here so that we could see what is going on?
You can also just remove the references to the VisualGDB version of the HAL via VisualGDB Project Properties -> Embedded Frameworks.
KeymasterHi,
If you would like to use fast semihosting, you would need to remove other implementations of the low-level I/O functions from the project. The default implementations from the toolchain shipped with VisualGDB are marked as weak, so they will be automatically replaced by the fast semihosting ones (when enabled), however if your project provides different implementations (in syscalls.c?) please try excluding them from the project (if you are using the GNU ARM toolchain, please disable regular semihosting on the first page of VisualGDB Project Properties).
KeymasterHi,
Yes, it could have been something caused by the project path. If you encounter this again, please try switching GDB Session to “All GDB interaction” and check the gdb messages about loading symbols.
KeymasterHi,
Looks like the project has not been built. Please ensure you build it before starting debugging.
-
This reply was modified 8 years, 2 months ago by
support.
KeymasterHi,
No problem, we will explain how the “Step into specific” functionality works.
First of all, VisualGDB doesn’t support “blacklisting” functions for automatic stepping through them yet (we will try to add this in one of the next releases), however it supports the “Step into specific” command as shown below:
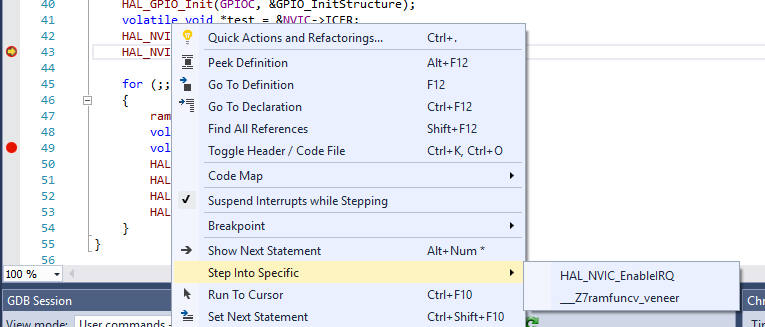
Normally it should work out-of-the-box, however if it doesn’t, you can fine-tune it by editing the StepIntoSpecific.xml file in the VisualGDB directory. The Step Into Specific feature works by disassembling the instructions corresponding to the active line in code and searching for the patterns defined in StepIntoSpecific.xml. Once a pattern is found, the corresponding label will be shown in the “Step into specific” menu and once you select it, VisualGDB will set a breakpoint at that instruction and then do a single “step in” step.
If it doesn’t work as expected and you are not sure how to adjust it, please let us know the details (i.e. your code and the output from the GDB Session window showing VisualGDB disassembling the current line) and we will help you get it to work.
Attachments:
You must be logged in to view attached files.KeymasterHi,
This could be happening due to an invalid FLASH mode/frequency. Please try experimenting with different FLASH modes (DIO/QIO) and setting the frequency to the minimum value.
KeymasterHi,
Sorry, this is a known issue (priority conflict between natvis engine and the C# visualizer API). We will try to address this is one of the next maintenance releases. As a workaround, please consider creating a basic visualizer using the C# API as described here: https://visualgdb.com/w/tutorials/visualizergettingstarted/
KeymasterHi,
You can check the mbed version used by VisualGDB via Tools->VisualGDB->Manage VisualGDB Packages. The latest version shipped with VisualGDB is 5.6.3, so the code in this example should normally work.
If you are getting strange mbed-related errors, you could also try importing the project directly from mbed-cli as shown in this tutorial.
KeymasterHi,
This could be caused by several different issues. Please check if the project can be built successfully. If not, please try creating a new project via VisualGDB Project Wizard and it will automatically get all the dependencies. If the build succeeds, but IntelliSense doesn’t work, please attach a screenshot of the entire Visual Studio window here and we can check for common problems.
December 26, 2017 at 03:54 in reply to: Some headers(errno.h etc) are not sync to local for openSUSE linux, strange ! #13339KeymasterHi,
Thanks, looks like VisualGDB was handling a certain type of hard links in tar archives incorrectly. We have fixed it in the following build: http://sysprogs.com/files/tmp/VisualGDB-5.3.18.1978.msi
Please note that you would need to reload the IntelliSense directories via VisualGDB Project Properties.
December 24, 2017 at 05:01 in reply to: Some headers(errno.h etc) are not sync to local for openSUSE linux, strange ! #13337KeymasterHi,
Different Linux distros may have slightly different include directory layouts, so please double-check that the files actually exist in the same directory on the other machine (please also double-check that you are looking at a correct folder on the Windows side – the dir.txt file should contain the remote directory name).
If you can confirm this, please try reloading all include directories via VisualGDB Project Properties. If this doesn’t resolve the problem either, please check that you can access the header files from your current user account (incorrectly set permissions would prevent VisualGDB from synchronizing those files properly).
KeymasterHi,
No problem, thanks for renewing. If you encounter any further problems, feel free to contact us again.
KeymasterHi,
No problem, please try this build: http://sysprogs.com/files/tmp/VisualGDB-5.3.18.1977.msi
KeymasterHi,
No problem, we have added this as an experimental feature to the following build: http://sysprogs.com/files/tmp/VisualGDB-5.3.18.1977.msi
To enable it, please create a file called <name of .vgdbsettings file>.vgdbsettings.<user name>.user with the following contents:
<?xml version="1.0"?>
<VisualGDBUserPreferences xmlns:xsi="http://www.w3.org/2001/XMLSchema-instance" xmlns:xsd="http://www.w3.org/2001/XMLSchema">
  <UserDefinedVariableValues />
  <DebugPreferences xsi:type="com.visualgdb.debug.embedded.preferences">
    <OverriddenSettings>
        <DebugMethod>
            <!-- Contents of the DebugMethod tag from the .vgdbsettings file -->
        </DebugMethod>
    </OverriddenSettings>
  </DebugPreferences>
</VisualGDBUserPreferences>
If you are not sure about the name of the file, try adding a live variable or a visual watch to your project and VisualGDB will automatically create the .user file.
The <DebugMethod> value from the .user file will now override the settings from the .vgdbsettings file (although the GUI may not edit the settings properly).
December 21, 2017 at 18:10 in reply to: SOURCEFILES list in makefile: multiline vs. singleline #13327KeymasterHi,
You can set this via Tools->Options->VisualGDB->General->Files->Max. items per Makefile line.
-
This reply was modified 8 years, 2 months ago by
-
AuthorPosts