Forum Replies Created
-
AuthorPosts
-
October 24, 2019 at 03:31 in reply to: CMake project not recognizing header files in sysroot/usr/local/include #26289
support
KeymasterYes, here’s the relevant command line:
cd E:/NCA/Webservice/branches/stability/Services/VisualGDB/Debug/src/comms && c:/SysGCC/raspberry/bin/arm-linux-gnueabihf-g++.exe --sysroot=c:/SysGCC/raspberry/arm-linux-gnueabihf/sysroot -IE:/NCA/Webservice/branches/stability/Services/spdlog -IE:/NCA/Webservice/branches/stability/Services/src/comms/include -IE:/NCA/Webservice/branches/stability/Services/plc/include -IE:/NCA/Webservice/branches/stability/Services/src/plc/include -g -Werror -std=c++14 -o CMakeFiles/NFC-PLC-Comms.dir/src/NFC_comms.cpp.o -c E:/NCA/Webservice/branches/stability/Services/src/comms/src/NFC_comms.cpp
However, it doesn’t seem to mention /usr/local/include at all, so most likely your project somehow overrides or resets the include directory list for the target. As the CMakeLists.txt structure was not created by VisualGDB, it’s hard to suggest a specific spot where it could be happening.
That said, if you have trouble navigating the CMakeLists files of this project, please consider re-creating it from scratch using the VisualGDB GUI for adding targets and setting their properties. This will ensure that all target properties will be stored consistently and won’t conflict with each other.
KeymasterHi,
Normally, the IAR should work out-of-the-box and modifying the Makefile should not be necessary.
Please double-check whether the IAR toolchain appears on the Toolchain Selection page of the VisualGDB Embedded Project wizard:
- When creating a new project from scratch
- When trying to import a project
If the toolchain appears while creating a new project and doesn’t appear while importing it, would you be able to send us the .ewp file so that we could check what is going on?
KeymasterThanks for clarifying this. Indeed, depending on the way the toolchain was built, the touch.exe command might depend on some other DLLs.
That said, if your Makefile track file dependencies properly, you can simply use the “cmd /c echo “//This file was updated” > trigger.h” command and include trigger.h from your main file. This will override the contents of trigger.h with the “//This file was updated” string, but will be otherwise equivalent to using the touch command. Also please consider setting up a custom VisualGDB shortcut for this operation, so you can conveniently trigger it via the VisualGDB menus when needed.
KeymasterThanks for confirming your support status. Please find the answer to your inquiry below.
The ‘touch’ command is part of the coreutils package and is typically used to reset the last modification time of a certain file without actually changing its contents. Normally, if you are moving away from an older toolchain, we would advise converting the Make-based projects to MSBuild, as it abstracts out many low-level commands and is better integrated into VS (e.g. it will automatically rebuild the files affected by a change in compiler flags, eliminating the need to manually manipulate timestamps).
Feel free to let us know why you need to use the touch command in your Makefiles and we will try to suggest a better way to do it with VisualGDB and MSBuild.
If you absolutely need to use the ‘touch’ command, it should be OK to simply copy it from the original toolchain and check it into your source control system. It should not have any dependencies on the other toolchain components, so you don’t need to copy the entire toolchain. Also the “cmd /c copy /b filename.ext +,,” should work as long as you prefix it with “cmd /c” and run it in the correct directory.
KeymasterNo problem, we have pinpointed and fixed the issue in the following build: http://sysprogs.com/files/tmp/VisualGDB-5.5.1.3328.msi
October 22, 2019 at 19:22 in reply to: CMSIS-DAP device showing up multiple times and debug fails #26270KeymasterThe Toolchain.xml file should be in the location where you have extracted the toolchain during step 1 of this tutorial. If you believe the file is not there, please try downloading/extracting it again and if it’s still missing, please send us a screenshot of the directory with the unpacked toolchain archive.
The OpenOCD installed into %LOCALAPPDATA% is automatically managed by VisualGDB. You can use the Tools->VisualGDB->Manage VisualGDB Packages to automatically update it (VisualGDB normally checks for updates every week). That said, updating OpenOCD would indeed not solve the original problem, as we have not had a chance to reproduce it. If you could step through the OpenOCD source code as it tries to start a debug session with the explicit serial number specified via command line and let us know why it is not handling the serial number argument as expected, we should be able to integrate the fix for it in our OpenOCD fork.
KeymasterHi,
It looks like most of the delay happens before gdb sends a reply to the first command. This could be caused by the antivirus interfering with its load, or by extremely slow disk performance. Please try starting the gdb executable manually and observe whether it also takes 16 seconds before it produces any output. If yes, please try disabling any 3rd-party software that could be interfering with this, or try experimenting to see if any other tools (e.g. gcc) get affected.
KeymasterThanks for letting us know. Looks like some solution-related events come in the order not expected by VisualGDB. Please let us know if you open the project via file File menu in Visual Studio, or by clicking on the .sln file in Explorer. Please also let us know whether there are other projects in the same solution and what is the type of the project (Embedded, Linux, Arduino, etc.).
KeymasterHi,
We are prioritizing GUI redesign of different parts of VisualGDB based on the redesign complexity, usability impact of the existing WinForms rendering for a specific part of the GUI and the number of affected users. As for now, we are prioritizing other functionality over conversion of this page.
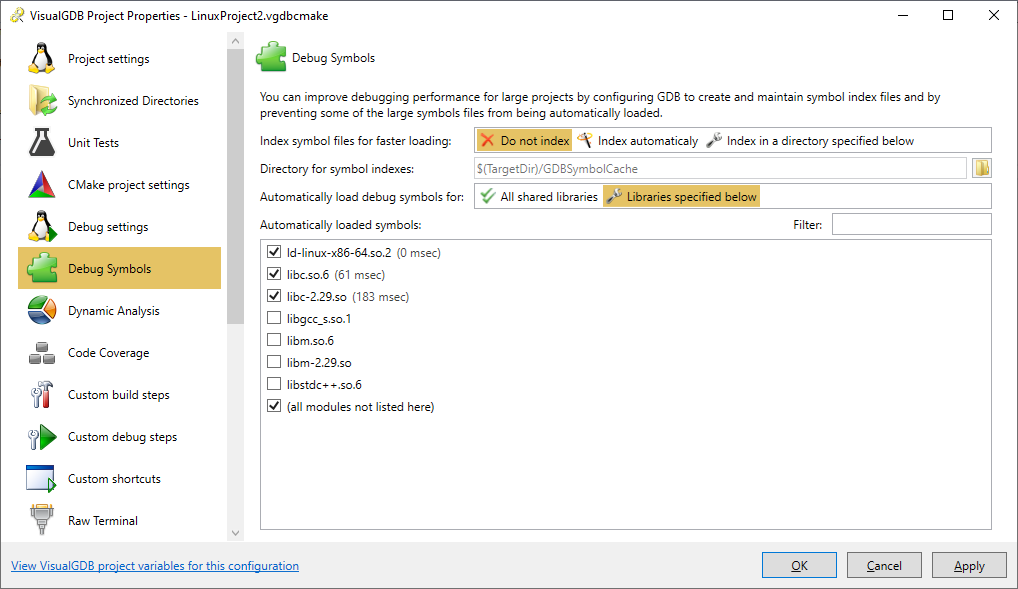
KeymasterHi,
Just wanted to let you know that we have added full support for specifying which symbols get loaded automatically for Linux projects in the following build: VisualGDB-5.5.1.3322.msi
You can configure it via the Debug Symbols page of VisualGDB Project Properties:
Attachments:
You must be logged in to view attached files.KeymasterSorry, most likely you have changed some settings or installed a new version of a toolchain/BSP that was not compatible with the existing projects.
Although we do our best to keep VisualGDB releases backward-compatible, it is not possible for us to guarantee the same behavior for every external toolchain, SDK or library that could be possibly used with VisualGDB, sorry.
KeymasterSorry, it looks like your support period has expired. Please consider renewing it here in order to continue receiving technical support.
KeymasterSorry, it looks like your support period has expired. Please consider renewing it here and we will help you get everything to work.
October 19, 2019 at 15:36 in reply to: ESP-IDF, arduino as component : Where to place third party librairies ? #26238KeymasterNo problem, we have added it to the backlog and will consider making a tutorial on this in the future.
KeymasterThanks for pointing this out, please try the following build instead: VisualGDB-5.5.1.3317.msi
-
AuthorPosts