Forum Replies Created
-
AuthorPosts
-
January 9, 2020 at 18:25 in reply to: Adding additional memory segment crashes if I don't use Fixed-size stack &Heap #27014
support
KeymasterNo problem, please find the explanation below:
- When NOT using fixed heap/stack, VisualGDB projects will use the default gcc/newlib logic for placing stack/heap:
- The stack begins just before the _estack symbol (typically, end of RAM) and grows downward (i.e. address decreases with each push).
- The heap begins after the end symbol (per linker script) and grows upward.
- There are no hard stack/heap size limits. Each time the heap is extended, the heap logic checks whether the new end-of-heap would be beyond the current stack pointer. There is no check for stack pointer overrunning into the heap later.
- When using fixed stack/heap, VisualGDB does the following:
- It adds the ReservedForStack and FixedSizeHeap symbols into the built executable (see the StackAndHeap.c file).
- The heap is located inside the FixedSizeHeap variable and will never grow beyond it.
- The stack is still located _estack (growing downwards). It gets to use the space allocated for ReservedForStack and all the space after it (before the end of RAM). The ReservedForStack variable ensures that you get a link-time error if there is not enough space to place the requested stack size.
You can see this by reviewing the .map file produced by VisualGDB (use the VisualGDB Project Properties or VS Project Properties -> Linker to enable map files) or by using the Embedded Memory Explorer.
Currently, VisualGDB does not offer any special tools for analyzing hardfaults, sorry.
January 9, 2020 at 18:12 in reply to: Adding additional memory segment crashes if I don't use Fixed-size stack &Heap #27012KeymasterSorry, this is way too project-specific and is not covered by our regular product support. We can help you understand specific settings of VisualGDB, but we are not able to troubleshoot project-specific issues without charging consulting fees.
January 9, 2020 at 16:32 in reply to: Adding additional memory segment crashes if I don't use Fixed-size stack &Heap #27009KeymasterSorry, this looks like a project-specific issue (e.g. stack/heap overflow somewhere in the code), so we can provide limited help on this topic.
Our best advice would be to use the Embedded Memory Explorer to compare the memory layout of the 2 builds (https://visualgdb.com/tutorials/arm/comparebuilds/) and try making something in between to narrow down the problem (e.g. manually fill the same area of the FLASH memory with 0xFFs).
KeymasterHi,
Indeed, Dynamic Analysis is only available starting from the Custom edition.
KeymasterHi,
VisualGDB supports the imxrt devices by importing the SDKs generated by the MCUXpresso tool. Hence, as long as you have an SDK for imxrt106, you should be able to import it into VisualGDB.
Please see this tutorial for details and let us know if you have any further questions.
KeymasterThanks for clarifying this. The scenario you described could be accomplished using a custom MSBuild task, however it would require some additional scripting.
Please try creating a custom MSBuild task class as shown on this page and ensure it has a “GeneratedMakefile” parameter. In your .vcxproj file, add the following target:
<Target Name="PatchMakefile">
    <MyTaskName GeneratedMakefile="$(RemoteBuildMakefile)"/>
</Target>
Make sure you reference your custom task assembly using the <UsingTask> tag. Finally, edit the <VisualGDB Directory>\MSBuild\MSBuild\Targets\remote.targets file as shown below:
<Target Name="CommitRemoteBuild" Condition="('$(IsRemoteBuild)' == 'true') and ('$(DesignTimeBuild)' != 'true')" DependsOnTargets="PatchMakefile">This will invoke the custom Makefile patching task after VisualGDB writes most of the targets there (the lines before the “.PHONY: $(PREPARE_TARGETS) …” line) but before it starts Make.
Let us know if this works and we will update the remote.targets file shipped with VisualGDB to use a project-level variable so that you won’t need to patch it.
If you would like to patch the Makefile after VisualGDB writes the final lines to it, please try inserting your task between the FinalizeRemoteBuildMakefile and LaunchVisualGDB tasks in remote.targets. If this works, we can update the file on our side to allow plugging custom tasks at this point as well.
KeymasterHi,
Sorry, it looks like the issue it not caused by VisualGDB, but instead some STM32-specific clock settings might be incorrect. Please consider posting on the STM32 forums to get help specific to STM32 devices.
KeymasterHi,
Good to know it works. The OpenOCD scripts for STM32 devices are normally maintained by ST, so they should just work out-of-the-box as long as you are using an OpenOCD version that matches them.
In case of any further strange errors, please consider deleting the OpenOCD directory entirely and re-installing it via VisualGDB Package Manager.
KeymasterThanks, we have noted it and will try to assign a higher priority to this, although it’s hard to give any estimates at this point.
KeymasterHi,
Due to the MSBuild design constraints, VisualGDB indeed only has access to a handful of MSBuild macros. Specifically, you can use:
- $(ProjectDir) (derived from the .vgdbsettings file location)
- $(ConfigurationName)
- $(SolutionDir)
- $(SolutionPath)
You can view the available macros via a link at the bottom of the VisualGDB Project Properties window.
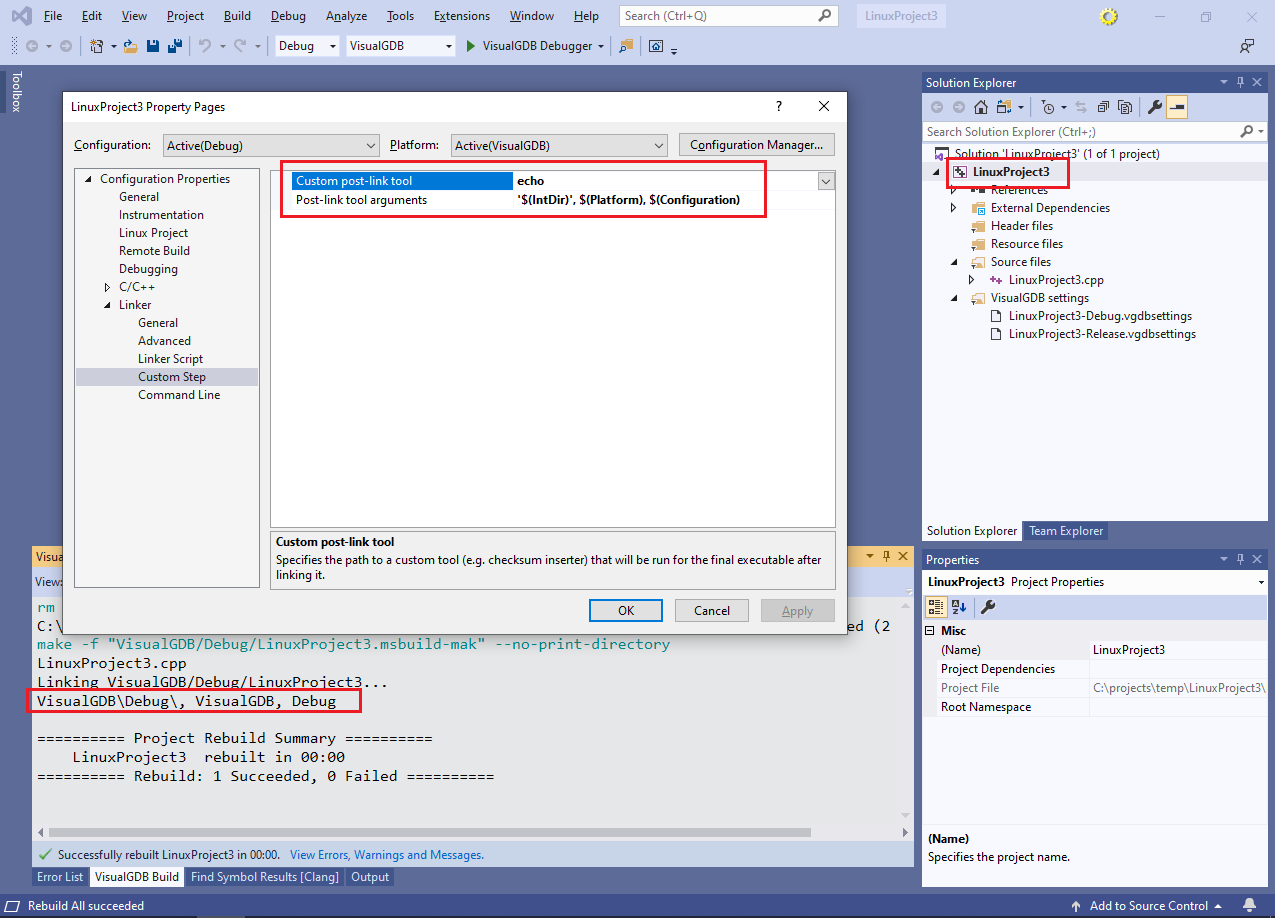
If you would like to use MSBuild macros instead, please consider using the VS Project Properties -> C/C++ (or Linker) -> Custom Step option. This works on MSBuild level and allows referencing any MSBuild variables. It is also possible to add custom MSBuild targets (that would result in additional entries in the generated Makefile), although it is more complicated to setup. Let us know if you need more details on that option.
KeymasterPlease try using the following syntax:
/projectconfig "Release|VisualGDB"
Note the quotes and no spaces.
KeymasterHi,
Based on the error message you shared, it looks like VisualGDB is not installed on the machine you are using to build the project.
Please ensure VisualGDB is installed and activated on the user account used to run the automated builds.
Please feel free to look through the following tutorial for a detailed step-by-step example: https://visualgdb.com/tutorials/ci/tfs/
If you can confirm that VisualGDB is installed, please try building the solution using devenv.exe, not msbuild.exe (see this page).
January 3, 2020 at 17:35 in reply to: Request a visualGDB tutorial to use LittlevGL and ESP32 #26969KeymasterSorry, this is way to specific to be covered directly. Please consider asking on the Littlevgl or ESP32 forum.
KeymasterSorry, this is by design. Different boards have different clock configurations, so unless you specifically clone a sample designed for your board (via the “STM32CubeMX Samples” switch in the wizard), you would need to adjust the clock settings to match your board.
If you believe the clock configuration for a board-specific sample in invalid, please consider reporting it to ST, as VisualGDB takes the STM32CubeMX samples directly from the STM32 SDKs.
- When NOT using fixed heap/stack, VisualGDB projects will use the default gcc/newlib logic for placing stack/heap:
-
AuthorPosts