Forum Replies Created
-
AuthorPosts
-
support
KeymasterHi,
Please refer to the following page for details: http://visualgdb.com/support/oldpackages/
KeymasterSorry, the names shown in the VisualGDB installer come directly from the Visual Studio installer interfaces and it looks like the VS installer reports both versions the same way.
As this is a fairly rare scenario, our advice would be to find out experimentally which of the checkboxes corresponds to the instance you need. Once you select it, VisualGDB will remember it when installing updates, so you won’t need to do it again.
February 3, 2020 at 20:56 in reply to: Variables are not initialized (RAM with address 0x10000000) #27324KeymasterHi,
Thanks for providing the repro files. It looks like the imported project is missing a reference to the startup file (startup_stm32f429xx.s), hence it indeed won’t work.
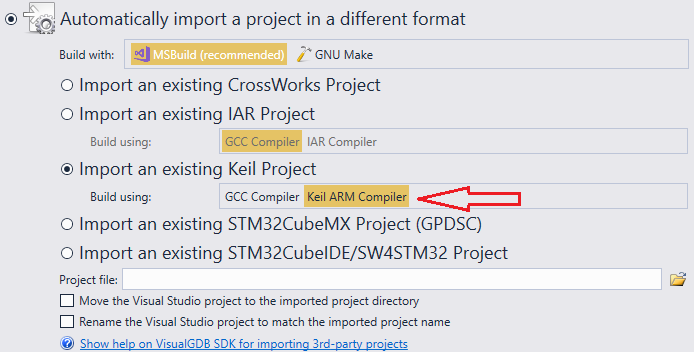
Most likely, this happened because you did not select to use the Keil compiler when importing the project (see below). Please double-check both first and the second pages of the wizard have the Keil compiler selected (sorry, those settings are currently separate due to backward compatibility):
Another difference between the projects is that the Keil project is built with full optimization, while VisualGDB project has the Debug configuration selected. It should normally not cause any problems, but some project-specific bugs can only be triggered in one of configurations, but not the other one. Hence if adding the startup file doesn’t solve the problem, please try checking whether the Release configuration of the VisualGDB project works as expected.
Attachments:
You must be logged in to view attached files.KeymasterNo problem. We have rechecked everything and found the root cause. Turns out, that the logic responsible for automatically locating missing packages was not always updating the package definitions, hence it would not find the very recently released packages. We have fixed the issue in our development branch and will include the fix in the next Preview release of v5.5.
KeymasterHi,
Please try reproducing the problem with the command-line gdb and OpenOCD tools. If the problem persists, please contact Espressif for help.
If the problem only happens when using VisualGDB, we can help you compare the setups and replicate the results of the command-line session with VisualGDB.
February 2, 2020 at 17:11 in reply to: Variables are not initialized (RAM with address 0x10000000) #27318KeymasterNo problem, we will try to help you. The steps you provided should normally work, hence the issue is likely caused by some combination of settings that were not explicitly mentioned. Hence, following the generic steps on our side will very likely not reproduce the problem.
We can still help you resolve this, however we would need you to do the following additional steps on your side:
- Locate the project generated by STM32CubeMX that you imported into VisualGDB. Open it using the Keil IDE.
- Add the same scatter file to it. Make sure it is exactly the same as the scatter file you used with the VisualGDB project.
- Build the project with the Keil IDE and make sure it works as expected.
- Try comparing the memory layouts and symbols of the 2 projects using VisualGDB’s Memory Explorer (you can choose the .axf file produced by Keil as a reference).
- If the comparison doesn’t point to a specific cause, please create a .7z archive of the VisualGDB project (including all relevant sources and the output file) and the equivalent Keil project (including all the relevant sources and the .axf file) and attach it here. If the archive is too large, please try using a file hosting service, such as Google Drive.
If we could build both projects on our side and confirm that they behave differently despite using the same sources, we should be able to update VisualGDB to replicate the output of the Keil IDE.
KeymasterHi,
This is by design. The “Fixed Stack/Heap” framework only works when using the StackAndHeap.c file provided by it and a VisualGDB-generated linker script that is compatible with the file.
The options in the GUI simply define the FIXED_STACK_SIZE and FIXED_HEAP_SIZE macros that are used by StackAndHeap.c.
If you are using your own logic for managing stack/heap, you can either specify the macros it expects manually, or update it to use the macro names used by VisualGDB.
If you would like to avoid using the startup file shipped with VisualGDB, please consider updating to the latest EFM32 BSP (v5.9.1). It adds a checkbox allowing to exclude the startup file to VisualGDB Project Properties.
February 1, 2020 at 02:27 in reply to: Code-Formatting: How can I change Brace-Position in Control Blocks #27311KeymasterThanks for the screenshot. Looks like you are using the legacy formatter, so the clang-format settings are irrelevant.
We have double-checked the configuration you mentioned. The option you mentioned controls an extra newline between “{” and “}”. In order to control whether “{” gets on a separate line, please use the “New control blocks” option instead.
KeymasterHi,
Most likely, you are using the Linux or Embedded license that does not support custom build steps (see this page for the full list of custom features).
You can find out the used edition via Help->About VisualGDB or upgrade it at this page.
You might be seeing the Custom edition GUI on other machines because the trial there has not expired yet (all VisualGDB features are unconditionally available during the trial period, even if a valid key has been entered).
Finally, you might be able to customize the build without the VisualGDB’s GUI by tweaking the Makefile, although using the Custom Steps GUI should be usually much more convenient.
KeymasterHi,
Version 5.3 is very old, so it indeed may not work as expected with the latest VS updates. Please try updating to VisualGDB 5.5 Preview 3 (you would need to renew you key here first).
KeymasterThanks, this partially explains what is going on. TryReadInstructions() is implemented inside VisualGDB. It uses the objdump tool to disassemble the instructions at the specified address.
Most likely, something in the objdump output is preventing VisualGDB from handling this correctly. Would you be able to share the ELF file with us via our support page so that we can try reproducing the issue (please also mention the exact address that is not loaded correctly and the function that triggers it)? If not, we can provide instructions on getting the necessary information from the dump file, although it might take a few extra iterations.
KeymasterHi,
The location of the project/solution files is normally handled by VS itself (see the checkbox next to the project name/location fields when creating the project).
KeymasterThankfully, VisualGDB has much more to offer than just a shortcut for launching make.exe 🙂
Either way, thanks for the log files. Looks like the new logic for analyzing linker messages was working slower than expected for long build command lines. We have optimized it in the following build: VisualGDB-5.5.3.3470.msi
KeymasterNo problem. Please try right-clicking on the project node in Solution Explorer and select Add->Reference->Browse, then pick the full path to VisualGDBExtensibility.dll in the VisualGDB’s directory. This should resolve the build errors.
KeymasterHi,
No problem, we have updated the sample project resolving this. Please update your local git checkout.
-
AuthorPosts