Forum Replies Created
-
AuthorPosts
-
support
KeymasterThanks for sharing the detailed screenshots. Indeed, MSBuild would normally expand the MSBuild-level variables and the environment variables, but not VisualGDB-specific variables.
Please try this build: VisualGDB-5.5.5.3610.msi
Then open VisualGDB Project Properties -> User Variables and ensure that the variables you want to use from MSBuild have the “propagate to the environment” flag set. If it is already set, change any variable value and press “Apply” to force VisualGDB to rebuild the property files. This will generate a $(ProjectName)-user.props file in the project directory, that will list the variables exported to MSBuild.
VisualGDB will automatically include that file when building the project, letting you reference those variables across the MSBuild settings.
Let us know if you have any feedback about the new feature and we will be happy to make it even better.
KeymasterHi,
The path mappings for the Quick Debug presets can be edited by clicking the “edit source path mapping” button in the GDB Session window:
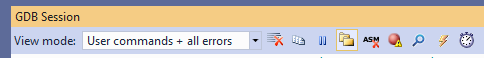
Please double-check that the mappings shown there match your setup.
If you are not sure, please attach a screenshot of the Edit Path Mapping window with your settings and we will help you understand what is going on.
Attachments:
You must be logged in to view attached files.KeymasterHi,
Please try checking ST-Link in the Windows Device Manager (View->Show Devices by Connection). Does it show the ST-Link Debug driver as shown below? If not, please try installing it manually (the drivers are located inside the ST-Link Tool directory).
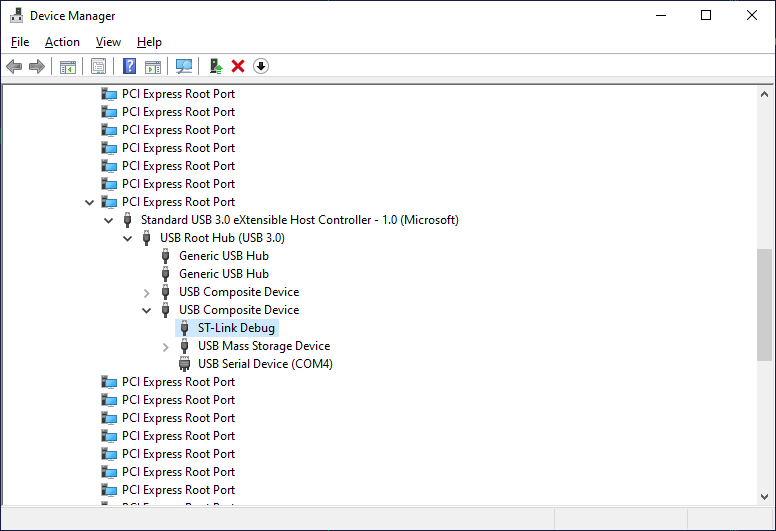
If not, or you are not sure, please attach a screenshot of the Windows Device Manager showing ST-Link in the Devices By Connection mode.
Attachments:
You must be logged in to view attached files.KeymasterHi,
This looks like an issue with the ESP-IDF itself and not something specific to VisualGDB. Please see our ESP-IDF troubleshooting instructions for help with narrowing this down.
KeymasterYes, please try VisualGDB 5.5 Preview 5: https://sysprogs.com/w/announcing-visualgdb-5-5-preview-5/
KeymasterHi,
mklink is actually a Windows command for managing symbolic links and is not specific to VisualGDB. We have included a link to the command documentation from Microsoft that would help you understand it.
Either way, you can check symbolic link functionality by opening the Windows command prompt via the Start Menu and then running the following command:
mklink /d c:\SysGCC\raspberry\test c:\SysGCC\raspberry\bin
If it fails, something on your system is interfering with the symbolic links and the toolchains may not work as expected.
Unfortunately the log you provided is a list of all warnings, but not the diagnostic log we requested (we have provided instructions on obtaining a diagnostic log in our previous reply). If the mklink command works, please attach a screenshot showing the output from it and the diagnostic log from the folder synchronization as instructed before, and we will try to help you troubleshoot this.
KeymasterHi,
Please try updating to VisualGDB 5.5 Preview 5. It includes automatic troubleshooting for missing references.
KeymasterHi,
No problem, we have updated VisualGDB’s IntelliSense engine to properly handle the “-x c++” flag for .c file in MSBuild projects. Please try this build: VisualGDB-5.5.5.3602.msi
Please make sure you delete the CodeDB folder before you open the solution, as it would contain cached settings from the previous version.
KeymasterHi,
Normally this should work. Please make sure you restarted VS from the Start menu (not from another program) after defining the new environment variable, as the environment is not immediately applied to all existing processes.
If it doesn’t help, please check the .vcxproj file and the .rsp files (you can read more about the .rsp files here) for the definition of the macro and also double-check it with running “echo %FOOSTR%” from Command Prompt.
If nothing helps, please share the contents of the .rsp file, the .vcxproj file and the output from echo %FOOSTR% and we can recheck for common issues.
KeymasterHi,
The “Add Folder Recursively” command is still supported, however it only works with VC++-based projects and requires the Custom edition or higher.
KeymasterStrange. Running the synchronization as Administrator should get the symlinks to work. Please double-check that you actually run the correct instance of Visual Studio as Administrator. If it doesn’t help, please try checking whether the mklink command works. If this doesn’t help, please let us know which Windows version you are using.
The FILE structure should be declared in <sysgcc>\raspberry\arm-linux-gnueabihf\sysroot\usr\include\arm-linux-gnueabihf\bits\types\FILE.h. Please check whether the file exists. If not, please try enabling SysprogsSync logs via Tools->Options->VisualGDB->General->SSH->Log SysprogsSync Transfers and then check the log file for errors in nearby directories.
If it doesn’t help, please upload the log file to a file hosting service (e.g. DropBox) and share a link to it so that we could check what is going on.
KeymasterHi,
Please try resetting the Python environment as shown here: https://visualgdb.com/documentation/espidf/#python
KeymasterHi,
It looks like the first set of warnings refers to unreadable target directories that should not be related to the build, so you can safely ignore them.
The second set of warnings looks like Windows does not allow creating symbolic links for some directories. Please double-check that the toolchain is installed on a NTFS volume (required for symlinks). If it doesn’t help, please try running Visual Studio as Administrator, as sometimes symlink problems are caused by missing permissions.
KeymasterHi,
This is a known bug in the STM32CubeMX generator. It doesn’t properly escape the “&” symbol in the generated XML files (i.e. produces “value1&value2” instead of “value1&value2”). The easiest workaround would be to patch the file manually before importing it into VisualGDB.
Please also consider reporting this to ST, as the issue is on their side.
KeymasterThanks, we have reproduced the problem and fixed it in the following build: VisualGDB-5.5.5.3599.msi
Let us know if you encounter further issues and we will be happy to help.
-
AuthorPosts