Today we are proud to announce the next Preview build of VisualGDB 5.4. This build introduces several major usability improvements in the embedded project workflow and I will give you a quick overview of them here.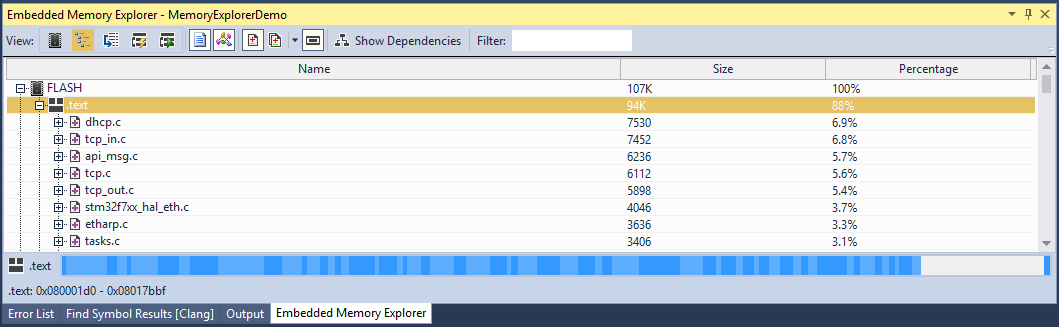
Supercharged Embedded Memory Explorer
If you were using VisualGDB for embedded projects before, you are probably familiar with the Embedded Memory Explorer. It’s a handy tool that shows you the exact amount of FLASH/RAM used by various parts of your program, so you could keep your firmware size in check. In VisualGDB 5.4 Preview 5 we decided to extend it far beyond just showing the symbol sizes, so it will help you see everything you want to know about your firmware at a glance.
Visual Section Layout
One common source of problems with embedded code is unexpected layout of various sections in memory. Bootloaders, softdevices, embedded resources, you name it. To make sure you get it right from the first try, the new memory explorer comes with a mode that visualizes the exact section locations in each memory as opposed to just showing the utilization progress bars: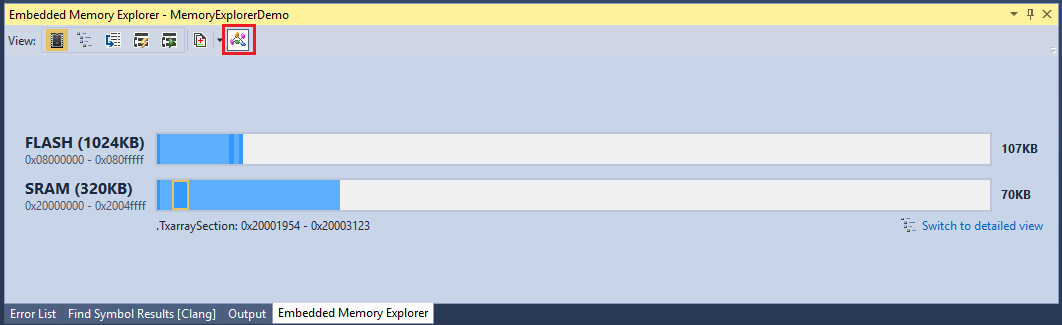
Same works for the symbols inside sections – just ensure that the utilization bar is enabled and you can get a very good visual overview of symbols, relative sizes, alignment gaps, etc.: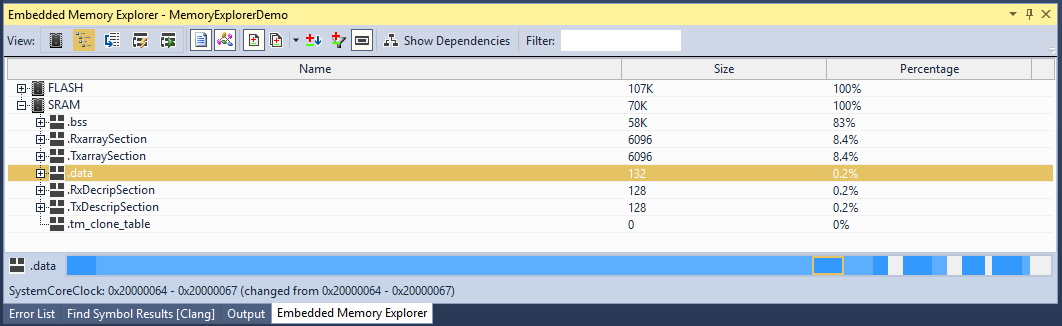
Differential View
Another tough job related to embedded memory optimization is comparing several versions of code. Previously in order to see the exact differences between 2 versions, you would either need to compare either the map files, or the memory explorer screenshots. VisualGDB 5.4 Preview 5 makes this process dramatically easier by allowing to automatically compare 2 versions of a binary: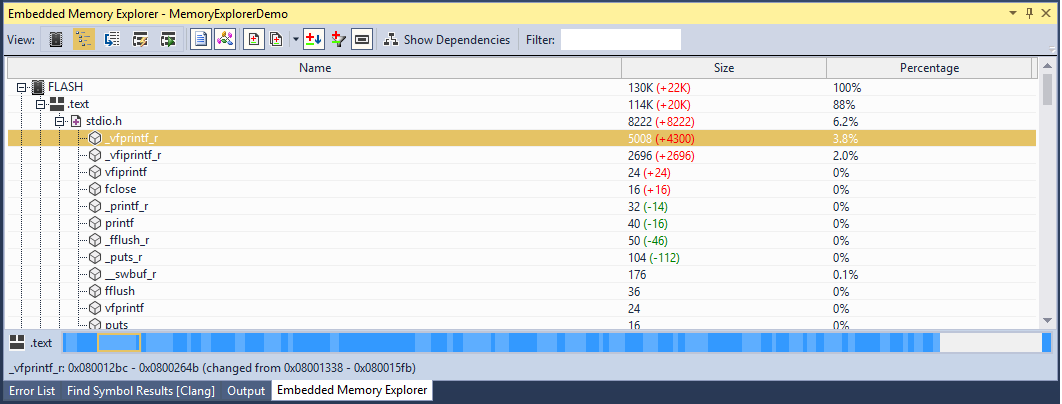 Depending on your goals, you can sort the results by absolute sizes, or the differences between the 2 versions, automatically compare against the previous build, or create named checkpoints and compare your code against them.
Quick Disassembly
If you were often experimenting with various low-level optimizations and reviewing the assembly produced by the compiler, VisualGDB 5.4 Preview 5 will make your life easier. Simply enable the Quick Disassembly in the Embedded Memory Explorer and VisualGDB will disassemble the currently edited function from the latest build and will show it to you: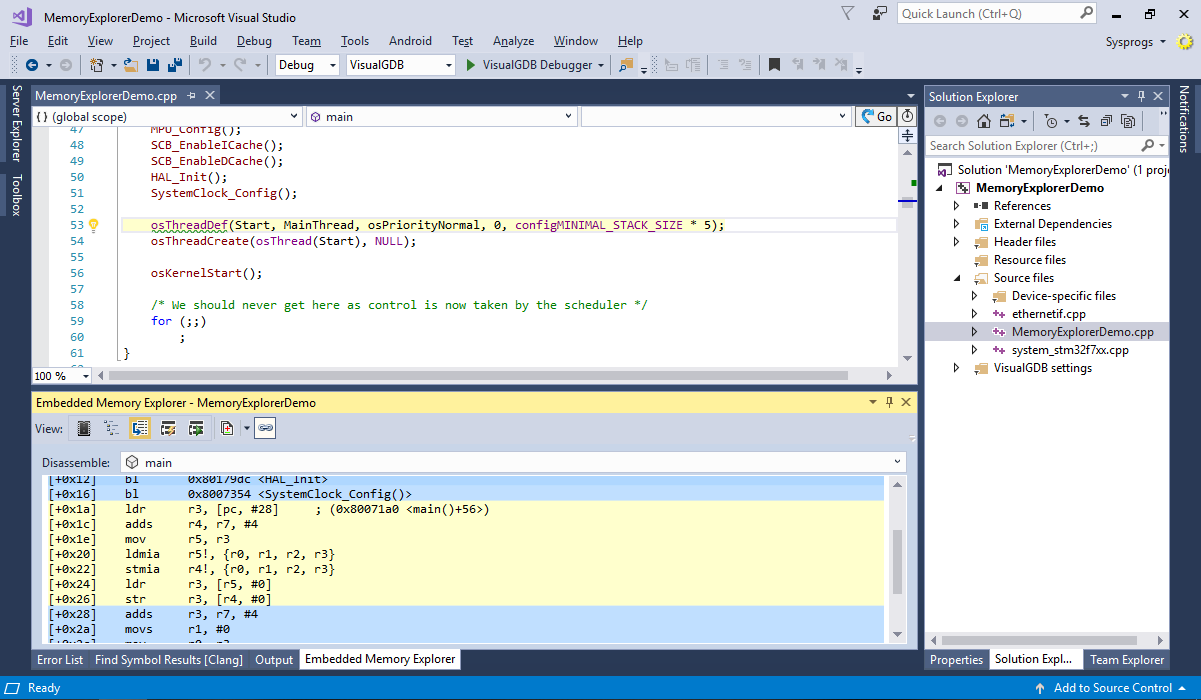
The disassembly view is synchronized with the source editor – click on either views and VisualGDB will highlight the matching source lines and assembly blocks.
Embedded Stack Analyzer
Another important metric of embedded firmware is the worst case stack usage by your program. To address this, VisualGDB 5.4 Preview 5 introduces the new Stack Analysis view in Embedded Memory Explorer: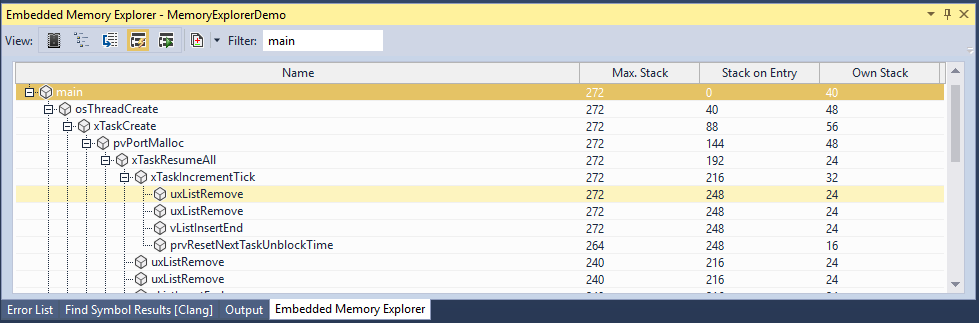
The static stack analyzer will disassemble your firmware, scan for instructions affecting the stack pointer and calling other functions, and will reconstruct the call tree and the stack usage from it. To make sure you can extend it to support complex scenarios (like dynamic/virtual calls), we have open-sourced the platform-specific part of the analyzer responsible for interpreting specific instructions and reconstructing calls and stack attributes for each function. Simply build the updated plugin, place it into the VisualGDB’s plugins directory and return an increased score when probing your ELF file and VisualGDB will use it instead of the regular plugin.
Debug Stack Visualization
To make it easier understand the worst-case stack layout, we have also added a new Debug Stack Breakdown view. Simply stop your program in a debugger and turn on this mode and VisualGDB will show detailed layout of the current stack and each variable in each frame known to the debugger: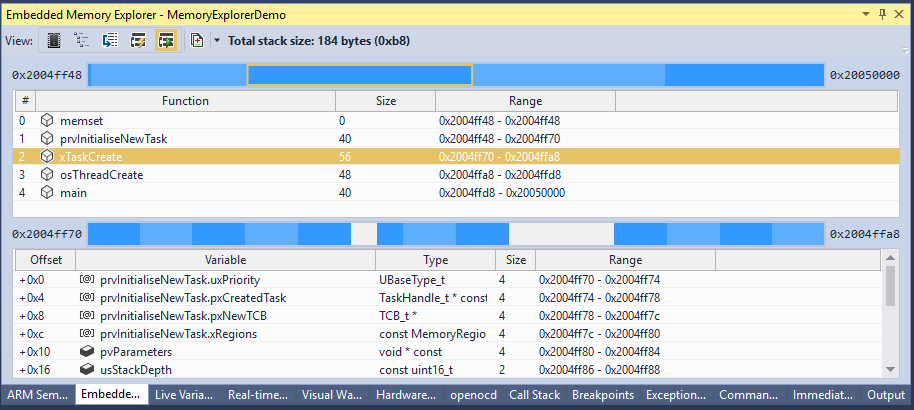
More usability
VisualGDB 5.4 Preview 5 comes with more usability features included. Check out the new embedded profiling window with easy sorting/grouping of instrumented functions, improved usability for Arduino and ESP-IDF projects and more: 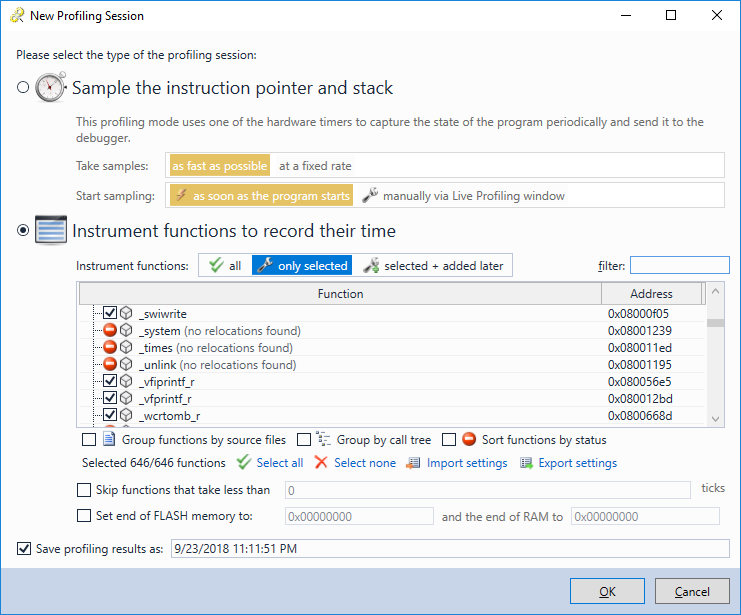
Try it out
You can download VisualGDB 5.4 Preview 5 on the download page. If you have any feedback, don’t hesitate to use our support form or the VisualGDB forum.