Forum Replies Created
-
AuthorPosts
-
support
KeymasterPlease note that VisualGDB is a productivity tool for software developers. It can make developers more productive by providing convenient GUI for common time-consuming tasks, and integrating various external tools into Visual Studio, so that they are always a few mouse clicks away.
We are able to offer VisualGDB at affordable price, because we focus on developing and supporting functionality that works the same way for multiple users, hence the development and testing effort is reused between multiple license holders.
We also receive a huge amount of inquiries asking to fix a specific broken project, help make the correct design choice, explain how a specific C++ feature works, or assist porting a library to a different platform. These inquiries require considerable effort to research and communicate the best solution. They do not scale between multiple users. I.e. helping one user solve this type of problem will not automatically help other users. It also does not help the same user avoid the same type of problem in the future. Hence, we are not able to address them within our regular support. If we included this type of help in our support, we would simply not have sufficient resources to provide it at the current license prices, or to allocate any resources to VisualGDB development.
We are happy to offer project-specific help via our consulting service per Zoom, TeamViewer or any other screen sharing service of your choice at our consulting rate and are happy to solve any problems our users encounter. This includes a detailed follow-up email at the end of the session, that includes an overview of the used techniques and a summary of solved problems and future recommendations.
Alternatively, please consider browsing our documentation and tutorials. Our documentation lists most VisualGDB settings, and the tutorials show how to use VisualGDB for in many real-world scenarios. Our technical support is limited to issues in VisualGDB itself, that can be reproduced from scratch per our problem reporting guidelines (i.e. do not depend on external projects that can potentially contain errors).
KeymasterThanks, we have received the ELF file, however we could not reproduce the problem on our side – the addresses are different:
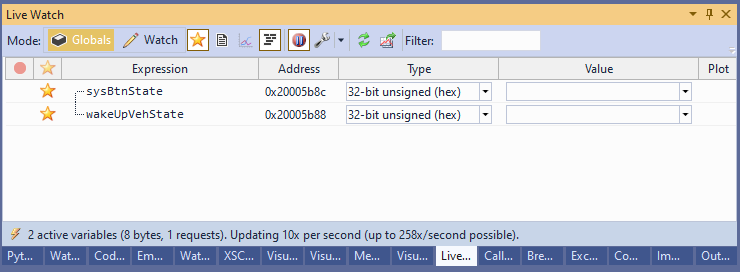
This could have been solved by a recent update to VisualGDB adding support to bitfields to Live Watch. Please feel free to update to VisualGDB 5.6r5 and let us know if the problem persists.
Attachments:
You must be logged in to view attached files.April 27, 2022 at 08:05 in reply to: Visual Studio: Update of VisualGDB failed, Reopen update dialog? #32567KeymasterHi,
You can manage VisualGDB toolchains and other packages via Tools->VisualGDB->Manage VisualGDB Packages.
KeymasterHi,
This looks like something coming from your system. All VisualKernel error messages are normally in English.
You can also try checking View->Other Windows->VisualKernel Diagnostics Console for more context on the error (e.g. stack trace).
KeymasterHi,
This looks like the ELF file you are debugging defines some variable attributes in an unexpected way, so VisualGDB fails to compute the proper addresses. If you could share the ELF file via our support form along with the correct addresses of the variables, we should be able to investigate this further.
KeymasterThanks for confirming it. We have rechecked the IAR folder and it looks like this type of register definitions is only used with 3 specific and very niche devices (RZN1D, RZN1L, RZN1S). Hence, VisualGDB does not support importing it automatically.
That said, the logic for converting SVD files into VisualGDB-specific register definitions is available here in our GitHub repository. Feel free to fork it and update it to parse the register definitions in the DDF format.
If you wish, we can also do it on our side, however, as it is unlikely to cover any mainstream devices (and help most other users), it would be subject to our consulting rate. Feel free to reach out to our sales to get a precise quote.
KeymasterHi,
We have just released an updated ESP32 toolchain based on the latest esp-2021r3-patch compilers and the recently released ESP-IDF v4.4.1. We have not specifically tested it with ESP32-S3 hardware, however, according to the Espressif’s changelog, it does appear to include a few fixes specifically for this device.
You can download it via VisualGDB Package Manager, or directly here: https://gnutoolchains.com/esp32/
April 20, 2022 at 10:11 in reply to: Log : cross-compiling openFrameworks to Raspberry Pi using VisualGDB #32537KeymasterHi,
You can find a detailed tutorial explaining the use of precompiled headers here. If it doesn’t work with your project, we would advise following the tutorial to get a working project, and then comparing the 2 projects side-by-side.
If you can pinpoint a specific setting that is not working as expected, feel free to let us know and we will help you find a workaround.
KeymasterHi,
Last time we checked, the DDF files only contained very high-level overview of the devices and did not list the exact peripheral registers. If it works differently for some devices, please let us know the exact device you are looking into, and we will investigate it further.
KeymasterHi,
Please refer to the following page for a detailed explanation of ESP-ADF vs. ESP-IDF versioning: https://visualgdb.com/documentation/espidf/#espadf
KeymasterHi,
Sure, you can either uninstall VisualGDB and install it back, or use the “Modify” button in the regular Add/Remove Programs window.
KeymasterThanks for letting us know and good to know it works. If the device vendor provides a usable toolchain, indeed, you can easily import it into VisualGDB and don’t need to build it yourself.
April 18, 2022 at 08:42 in reply to: Visual Studio gets stuck loading VisualGDB-based project #32512KeymasterHi,
Normally, VisualGDB checks for missing packages when loading the project, and displays a window suggesting automatically installing the missing ones. Most likely, something else in your setup interfered with this mechanism.
If you could confirm that a specific sequence of actions that can be reproduced from scratch, triggers the issue, we can gladly investigate it further (e.g. Create a project using the ARM toolchain -> Remove the toolchain via VisualGDB Package Manager -> Restart VS -> Open the project).
KeymasterHi,
Indeed, neither Visual Studio nor VisualGDB supports syntax highlighting in the assembly files. That said, it does not affect debugging. When you set a breakpoint in a source file, VisualGDB simply issues a -break-insert command directly to the gdb debugger, that in turn interprets the debug symbols and translates it to a physical breakpoint at a specific address. The process of translating source file locations to memory addresses is entirely done by gdb and is not affected by any IDE features. You can double-check the commands issued by VisualGDB to gdb via the GDB Session window.
If the breakpoints are not working, the assembly files could have been built without debug symbols, or some macros inside them might be interfering with the way gdb handles breakpoints.
You can also try using the Disassembly view in Visual Studio. It takes the assembly dump directly from gdb and knows the exact address of every line displayed there. Hence, breakpoints set via the Disassembly view will work regardless of the symbol issues.
KeymasterSorry for the delay. We have finally managed to reproduce the issue and it turns out it was caused by a race condition in the hardware register window initialization logic.
We have fixed it in the following build: VisualGDB-5.6.104.4554.msi
-
AuthorPosts