Forum Replies Created
-
AuthorPosts
-
support
KeymasterHi,
This looks like more of a generic CMake question than something specific to VisualGDB. Feel free to post it on CMake forums, if you get a CMake-specific advice, we can help you map it to particular VisualGDB settings. You can also dump the CMake command line used by VisualGDB to a batch file as shown here, and experiment by modifying the CMake command line directly instead of going through various VisualGDB settings. If you find a command line that works better, we can help you find VisualGDB settings that will replicate it.
The CMake files shown in Solution Explorer (including multiple instances of toolchain.cmake) are reported by CMake via the cmakeFiles-v1-<ID>.json files. The one used by VisualGDB should have the path of C:\Users\ XXX \libjpeg-turbo-2.1.4\./build/VisualGDB/Debug/toolchain.cmake. You can try using our CMake debugger to find out which file references the second one.
KeymasterYou are always welcome to create a project manually by following this tutorial. This will work for any device type that has a compatible GCC toolchain and is not directly supported by VisualGDB.
We can also create an out-of-the-box BSP if sufficient users with active licenses confirm their interest in this device family, or if anyone agrees to directly cover the research and testing costs, as we do for other niche devices.
KeymasterSorry about that, it’s indeed a bug introduced by another fix in v5.6R7. We have fixed it in the following build: VisualGDB-5.6.107.4696.msi
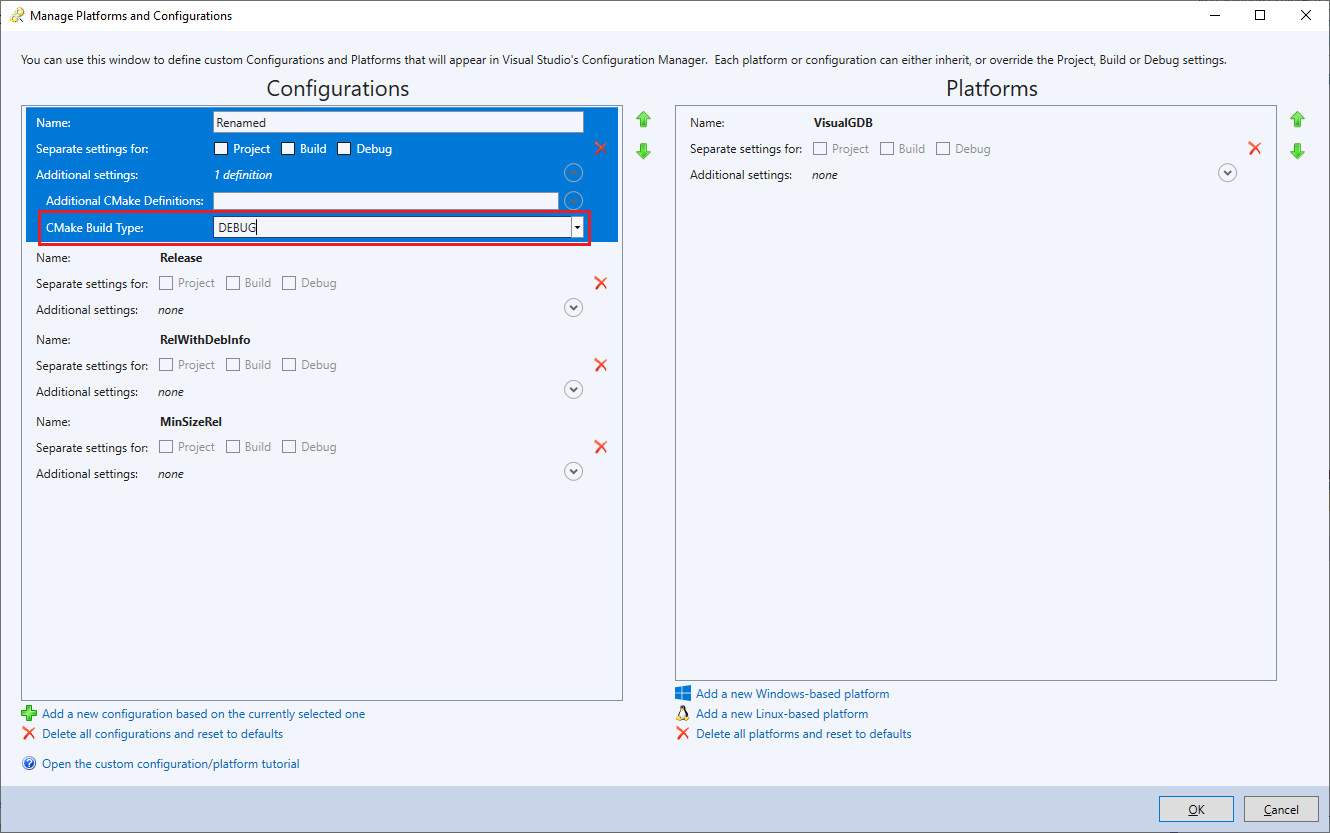
KeymasterThanks for the detailed screenshots, we would have never guessed what you were trying to do otherwise.
Below is the explanation of what is going on:
- Renaming the configuration from Debug to Renamed and not changing the build type changes the CMake command line issued by VisualGDB from -DCMAKE_BUILD_TYPE=DEBUG to -DCMAKE_BUILD_TYPE=RENAMED.
- CMake does not know the RENAMED build type, so it never passes the debug-specific arguments to GCC.
- In step 6 (08.jpg) you override the debug information format for the executable only (not the STM32CubeMX libraries). This happens because you do it via the properties for the executable (node with the console icon in Solution Explorer).
The workaround is extremely easy though: simply set the CMake build type to DEBUG for the renamed configuration, and it will automatically get the correct flags:
You can also proceed with your own custom build type (in case you need it for any reason) by adding the following lines to CMakeLists.txt:
set(CMAKE_C_FLAGS_RENAMED ${CMAKE_C_FLAGS_DEBUG})
set(CMAKE_CXX_FLAGS_RENAMED ${CMAKE_CXX_FLAGS_DEBUG})
That said, we would advise using the classical CMake build types (Debug/Release/RelWithDebInfo) and manually passing additional definitions to CMake if you need different configurations to produce different outputs.
Attachments:
You must be logged in to view attached files.KeymasterHi,
If you would like us to investigate the issue and release a hotfix, it would be reasonable to ask you to renew your support, as it has expired last January. If you do not wish to do it, you are welcome to continue using the product you purchased, however you would need to resolve any issues you encounter on your side.
KeymasterHi,
It looks like your technical support period has expired. We would be happy to help you, however we would kindly ask you to renew your technical support on the following page first: https://sysprogs.com/splm/mykey
KeymasterThanks for confirming this. It looks like the VS installer is now resetting the VS cache after each update (likely to work around the same type of problem that VisualGDB was working around), and that it temporarily makes the regular reset API return an error. We have updated VisualGDB to silently log any cache resetting issues instead of showing the error popup: VisualGDB-5.6.107.4689.msi. If you encounter any cache-related issues, you can view the log via View->Other Windows->VisualGDB Diagnostics Console.
KeymasterHi,
We have confirmed the issue. Updating from VS17.2 or later to 17.3 reset the fonts/colors cache in a way preventing VisualGDB from resetting it using the regular API. This happened only the first time Visual Studio is started after the update. On subsequent launches, the cache was consistent, and even forcibly resetting it worked as before.
Could you please clarify if the problem happened once (i.e. updating from a particular old VS version) or after each VS update (e.g. 17.2->17.3 and 17.3->17.3.1)? If every update triggers the message, we can hide it by default. If it only happens once after a specific VS update, it is safe to ignore.
KeymasterHi,
Sure, you can disable this behavior via the Detect Ambiguous Target Definitions option. See this page for the exact location of the option in the latest VisualGDB version.
KeymasterHi,
Sorry, this looks like something specific to your hardware and not a VisualGDB issue. If you need help getting debug interfaces working on your board, we can gladly provide it at our consulting rate.
Otherwise, please consider trying other debug methods (e.g. Segger J-Link or running OpenOCD manually). If you can get debugging working outside VisualGDB, we can help you configure VisualGDB to replicate the same results.
KeymasterHi,
Most likely, you have inadvertently overridden the CFLAGS for some files. You can use the techniques shown in this tutorial to verify whether the object files contain symbols.
If the symbols are missing, please try adding an #error directive to one of the affected files. If you are using Ninja, it will show the exact command line used to build that file. If the -ggdb option is missing, please double-check your CMake scripts.
KeymasterHi,
Sorry about that. We discovered a glitch in the original 5.6r7 release a few hours after it was published. As it would only affect VS2008 users, we simply replaced the original installer with a fixed version. Other than the VS2008-specific fix, both installers are identical, so we reused the same revision number.
If you are seeing this message, VisualGDB has downloaded the package catalog after the release, but before the fix. As a workaround, you can download the new VisualGDB update manually here. Other packages are not affected by this, so the error can be safely ignored.
KeymasterHi,
Please try following this tutorial. It shows how to setup an embedded unit test project and run the tests from command line. If you are not interested in the simulation platform, you can skip the relevant steps and only use the hardware platform.
KeymasterYes, installing VisualKernel inside a QEMU Windows VM running in a Linux machine very likely interferes with the target connection.
Such setup will require non-trivial QEMU configuration to ensure that the debug transport you would like to use works reliably between the Windows VM and the target. It is something for you figure out – VisualKernel cannot automatically do it from within a VM. In general, please make sure you can manually debug the target kernel by running gdb on the Windows machine manually (without loading the symbols for the kernel/modules). If not, please resolve your target communication issues before attempting to use VisualKernel.
Also, the “Cannot complete the smart archive without closing the ‘source’ area” error could be shown incorrectly if a different error prevents VisualKernel from downloading the kernel sources. We have fixed it internally: VisualKernel will display the correct error message starting from the next build. In Beta 1, you can find out the actual error via View->Other Windows->VisualKernel Diagnostics Console.
KeymasterUnfortunately, it is hard to suggest anything specific based on the description you provided.
In order for us to provide any help with this, we need to be able to reproduce the problem on our side.
Please provide complete and detailed steps to reproduce the issue as described below:- The steps should begin with launching Visual Studio. They should include every step necessary to create the project from scratch and reproduce the issue.
- Please make sure the steps do not involve any 3rd-party code as we will not be able to review it. If the problem only happens with a specific project, please make sure you can reproduce it on a clean project created from scratch.
- The steps should include uncropped screenshots of all wizard pages, VisualKernel Project Properties pages and any other GUI involved in reproducing the problem. This is critical for us to be able to reproduce the problem on our side.
You can read more about the best way to report VisualGDB/VisualKernel issues in our problem reporting guidelines, If you do not wish to document the repro steps and save the screenshots, please consider recording a screen video instead and sending us a link to it.
Please note that many VisualKernel issues are caused by selecting an incompatible combination of settings at some point. We are generally not able to review specific projects and find the specific settings that were set incorrectly. We recommend checking the projects into source control and keeping a track of all changed settings to avoid breaking the projects.
You can also try checking various diagnostic output from various parts of VisualGDB/VisualKernel as described on this page. Although we won’t be able to review it for a specific project unless the we can reproduce the problem from scratch, checking it might provide some clues on what is causing the unexpected behavior.
-
AuthorPosts