Forum Replies Created
-
AuthorPosts
-
support
KeymasterNo problem, please try this build: VisualKernel-4.0.101.2366.msi
In order to experiment with KDB->KGDB switching, please try disabling the explicit KDB->KGDB switch via settings, then open the .vkrnlproj file manually, and set the following elements:
- ExplicitSwitchFromKDB to false
- ManualSwitchFromKDB to true
VisualKernel will then display a message box asking you to do the switch manually after issuing a sysrq, but before connecting to the COM port. If this works, we can add a proper setting to run an arbitrary command line.
The new build also supports tracing without debugging. You can enable it as shown below or via Debug->Start VisualKernel Tracing Session. Tracing sessions run directly over UDP, do not require any other connection, however they do not stop the target, and instead record the selected variables in the background. You can use the techniques shown in our tracing tutorial to see what is going on at the target.
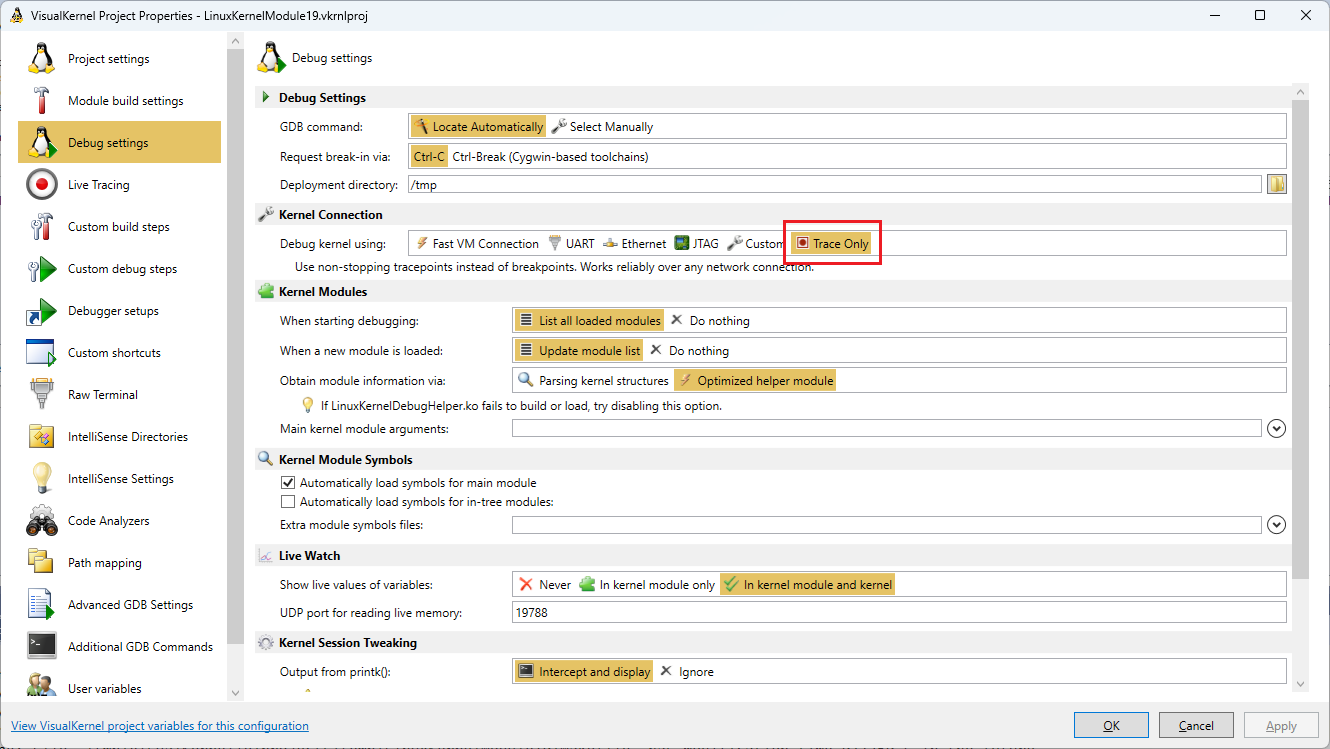
P.S. The tracing engine is a brand new feature, we are open to feedback on it and should be able to iterate on it very fast.
Attachments:
You must be logged in to view attached files.KeymasterHi,
Based on a quick search, the error code looks like some Windows files got corrupt (see this thread), so it’s hard to suggest a workaround that would definitely work.
You can try using Zadig – it uses a slightly different API for generating the drivers; another option would be to import the installed driver from another machine where it got installed (locate/copy the oemXXX.inf/.pnf/.cat files and point the Device Manager to the copied version), although it again may not work if some driver-related functionality is broken on your machine.
KeymasterNo problem, we have rechecked the Kernel Release workflow with the 3-machine setups, and indeed it was somewhat confusing. You can still add the .vkrnlrelease files to Solution Explorer by copying the full path to the Open File dialog, but it wasn’t suggesting the .vkrnlrelease extension automatically.
Please try this build: VisualKernel-4.0.101.2361.msi. It will now show the .vkrnlrelease files in the Add->Existing Project dialog, and will also point to the files inside the kernel release when stopped in a debugger, as long as the kernel release project is added to the solution.
April 30, 2023 at 15:35 in reply to: LinuxKernelDebugHelper Compile Fails In Ubuntu18 with kernel4.19 #34181KeymasterHi,
These errors come from the recently introduced Live Tracing engine that indeed was not tested with the older kernels (it works just fine with the recent 5.x versions though).
We have updated VisualKernel to automatically detect it and turn off the tracing engine if it detects an incompatible kernel. Please try this build: VisualKernel-4.0.101.2361.msi
If you would like to use Live Tracing on an older kernel, we can gladly backport it for you as long as you purchase a Standard VisualKernel license. If you would like to evaluate Live Tracing before purchasing, you can try it out on a more recent 5.x kernel (stock kernels coming with most Linux distros will work just fine).
KeymasterHi,
Sorry about the forum glitch. It appears to happen very rarely due to some cookie issues, however we were never able to reproduce it reliably.
Please try this build: VisualKernel-4.0.101.2360.msi. We have updated VisualKernel to automatically detect #include <stdarg.h> vs #include <linux/stdarg.h>. The error with ftrace_ops looks like your could you place check whether your ftrace.h file defines ftrace_ops? You can include it from any kernel module (or by temporarily editing any of the kernel sources) and IntelliSense will conveniently highlight the parts that are being parsed.
We have also updated VisualKernel to explicitly log where it issues the KDB->KGDB command. You can try enabling View->Other Windows->VisualKernel Diagnostic Console, start a debug session and double-check that it contains the “Sending ‘kgdb’ to COMx @<baud>” line. If if helps, we can also add a setting to display a message box after doing a sysrq trigger, so that you could try sending it manually in a terminal program and see if it works.
Regarding the frozen mode, enabling this mode updates the project file, so Visual Studio considers it outdated and tries rebuilding it, triggering a connection error. It should normally fail to connect, then ask you whether you want to try debugging the previous build result, and then it should work just fine. You can also try setting Tools->Options->Projects and Solutions->Build and Run->On Run -> Prompt to Build. This way Visual Studio won’t try to automatically build the outdated projects and you can choose to run it without having to wait for a connection timeout.
P.S. We have recently added a new feature that allows tracing arbitrary kernel functions and source lines (i.e. instead of stopping in a debugger, it just records the variables you selected and lets you review them later). It currently requires a regular debugging connection, however we are working on an update that will allow doing it without just a network connection (no KGDBoC/KGDBoE/JTAG required). Because of the delayed nature of tracing (the actual data transfer happens after everything has been recorded), it doesn’t cause any instability and works much faster than most debug methods. Let us know if you would like to try it out.
KeymasterSure, please see the attached file.
Attachments:
You must be logged in to view attached files.KeymasterNo problem. We did recheck it with shared projects, so the issue could be caused by something else (e.g. symlinks in the target paths or some particular path syntax).
It could have the same underlying cause as the synchronization problems, but it’s hard to pinpoint anything specific from the observations you are describing.
That said, you can track down the second problem fairly fast as shown below:
- Isolate a specific file that is not being re-uploaded. Confirm that just changing that one and building file doesn’t get it uploaded.
- Create a new project with just one file from scratch. Confirm that re-uploading works with the brand new project.
- Try gradually changing both new and old projects until they are equivalent (e.g. remove some files from the old one, add some files to the new one), rechecking the behavior after each step.
It typically takes less than 10 steps and almost always boils down to a 2-3 settings that were changed together in an unexpected way, and had an unintended side effect. You can also use diffing tools (e.g. KDiff3) to speed up the comparison.
Also, if you wish, we can do it for you via a screen sharing session at our consulting rate. It should take less than an hour to get it all sorted out (you only pay if it worked), however our consulting rate is fairly high and may not pay off depending on your constraints.
KeymasterHi,
Sorry about the build error. We have indeed recently replaced #include <stdarg.h> with #include <linux/stdarg.h>, resolving build issues on some kernels, and did not encounter any problems with the new version.
Can you confirm that changing it back to #include <stdarg.h> in the VisualKernel directory solves the issue? If yes, we can easily add an auto-detection logic for this.
Regarding KDB->KGDB, we added this feature while investigating the KGDBoC timeouts, however it turned out that it should not be normally needed – if you connect GDB to KGDBoC that is stuck in KDB mode, it should automatically detect it and switch, as long as the GDB timeouts are sufficient. We kept the new setting in place in case it helps work around other issues, however it currently only works when the COM port is connected to the Windows machine directly. If you are running GDB on Linux and connecting to /dev/pts/3, you can force the KDB->KGDB switch by running the following command line before connecting gdb:
echo kgdb > /dev/pts/3
This needs to be run on the gdb machine, so the target does not need to be accessible via SSH at this point. If this works better, let us know and we will update the switching logic to run this automatically.
KeymasterHi,
VisualKernel manages the kernel symbols via Kernel Releases – special read-only projects that include all necessary files, IntelliSense index, etc.
Normally, if you select the kernel release via Quick Debug Linux Kernel -> Kernel Symbols for Debugging, it will suggest adding the kernel release project to Solution Explorer first time you stop at some code within the kernel itself.
You can also add the .vkrnlrelease file directly to Solution Explorer by selecting Add->Existing Project and then pointing VisualKernel to the .vkrnlrelease file (see any of the module .sln files for the exact path).
KeymasterHi,
Normally, VisualGDB would invoke ‘chmod +x’ automatically when deploying files. You can double-check it via View->Other Windows->VisualGDB Diagnostics Console.
If you can confirm that it gets invoked intermittently, please try simplifying your setup (i.e. having just 1 project deployed at a time). Does it also fail to run chmod?
If VisualGDB runs chmod successfully, but the target appears to ignore it, it could be a glitch in the SSH server.
Either way, you can configure VisualGDB to run arbitrary commands before debugging via VisualGDB Project Properties -> Custom Debug Steps -> Before Launching Debugger.
KeymasterHi,
The shared projects would normally just copy the list of source files into the actual project referencing them, using the rest of the settings from the main project. We have just rechecked it on a very basic project, and it worked as expected.
You can double-check what is going on by isolating a specific project and a specific source file that does not get coverage, and then:
- Double-check that the project has the project-level instrumentation enabled (MSBuild Project Properties -> Instrumentation -> Generate Code Coverage Reports).
- Double-check that the GCC arguments for the source file include the “-coverage” flag. You can check it in the .rsp files (local build) or .msbuild-ninja file (remote build).
Alternatively, if you can reproduce the problem on a minimal project involving 1 shared file, 1 non-shared file and no other overridden settings, feel free to attach it and we will investigate it further.
April 24, 2023 at 11:17 in reply to: Hosting Web Apps on Raspberry Pi Pico W with the HTTP Server #34157KeymasterHi,
Semihosting is a mechanism used by the target to send some data (e.g. printf()-like output) to the debugger.
Unless you have changed the code in some way, it should not really be triggering. If you are not sure, please try doing a clean checkout of our PicoHTTPServer demo, and build it from scratch (make sure you also re-download and re-patch the Pico SDK). It should work just fine – we have double-checked it with the latest Pico SDK 1.5.0.
You can also use the Call Stack window in Visual Studio to see why exactly the semihosting gets invoked.
KeymasterHi,
Thanks, this explains it. VisualKernel automatically shows suggestions for COM ports up to COM4 (ttyS0..ttyS3), however as you needed to use ttyS4, you likely entered it manually, with the “/dev/” prefix, confusing the KGDBoC module.
We have updated VisualKernel to explicitly mention the parameters echoed to the parameters file in the error message, to make it easier to diagnose this type of issues. We have also added COM ports up to COM8 (ttyS7) to the selection list.
Feel free to try this build: VisualKernel-4.0.101.2357.msi
April 21, 2023 at 08:34 in reply to: Hosting Web Apps on Raspberry Pi Pico W with the HTTP Server #34146KeymasterHi,
It worked just fine in our tests, so most likely you are doing something different.
You can try using the Debug->Attach to Running Embedded Firmware command to attach to it once the problem manifests itself, so that you could see what the device is doing.
KeymasterHi,
Thanks for your clarification. VisualKernel handles KGDBoC as follows:
- Runs “cat /sys/module/kgdboc/parameters/kgdboc” on the target and compares the output with the contents of the <KgdbocArguments> element in the .vkrnlproj file.
- If they are different, runs “sh -c “echo <args>” > /sys/module/kgdboc/parameters/kgdboc“. If this command fails, it displays the “cannot configure KGDB” error.
Based on what you are describing, it looks like the KGDBoC parameters configured via VisualKernel GUI are rejected by the kernel and it ends up with KGDBoC disabled. You can verify it very easily by comparing the contents of the <KgdbocArguments> element to”ttyS4,115200“. If it’s different, you can just patch it manually and reopen the solution – VisualKernel will then try to use the KGDBoC configuration you entered manually.
-
AuthorPosts