Forum Replies Created
-
AuthorPosts
-
support
KeymasterHi,
You might be running a firewall on the Raspberry Pi side. You could try checking with Wireshark whether there’s any reply from Raspberry Pi when you try connecting to that port. Another option would be to try other ports or use netcat instead of OpenOCD to listen to incoming connections to see if the problem is caused by OpenOCD (it might be listening exclusively on the 127.0.0.1 socket).
KeymasterHi,
Sorry for the delay. We are still planning to add this in the near future, as soon as we complete finalizing the Arduino support. Please expect this to be available in the next 3-6 weeks.
KeymasterHi,
As OpenCV is natively built with CMake, referencing it from a QMake-based project would involve non-trivial amount of manual settings edits.
Instead we would advise creating a CMake-based Qt projects (see this tutorial for details) and then referencing OpenCV using the regular find_package logic (see this tutorial).
If this is not an option, let us know and we can help you understand the logic behind the library paths and names so you could find the correct settings for the QMake project.
June 17, 2018 at 00:33 in reply to: Unable to set any breakpoints in a particular ESP-IDF project #21146KeymasterHi,
Thanks for running this. This build didn’t contain any fix yet – it only contained extra logging that helped us understand what was causing the problem. Turns out the customization to the project made VisualGDB treat the ESPFS pseudo-binary as the primary project output (see second line below):
 /cygdrive/c/Users/Don/Documents/esphttpd-freertos/Debug/bootloader/bootloader.elf: 0 inputs, IsStaticLibrary=False
 /cygdrive/c/Users/Don/Documents/esphttpd-freertos/Debug/libesphttpd/webpages.espfs.o: 0 inputs, IsStaticLibrary=False
 /cygdrive/c/Users/Don/Documents/esphttpd-freertos/Debug/webserver.elf: 0 inputs, IsStaticLibrary=False
Now that we have pinpointed the root cause, we were able to fully fix it. Please try this build, it should work out-of-the-box (you may still need to clean the project): http://sysprogs.com/files/tmp/VisualGDB-5.4.3.2316.msi
KeymasterHi,
No problem, we have fixed the navigation bar issues in this build: http://sysprogs.com/files/tmp/VisualGDB-5.4.3.2315.msi
Please use the Tools->Options->Text Editor->C/C++ (VisualGDB) to configure the tabs/spaces for the VisualGDB projects. Unfortunately the language service design inherited from Visual Studio forces this to be a separate setting from the regular C/C++ tabs/spaces. You can also set the position of the new braces via Tools->Options->Text Editor->C/C++ (VisualGDB)->Formatting->Newline Insertion->New types.
The new build also contains experimental support for clang-format, including an interactive style editor. You can enable it via VisualGDB Project Properties -> IntelliSense Settings. It is a complete drop-in replacement to the regular formatting engine and is heavily optimized to seamlessly run in the background.
June 15, 2018 at 22:05 in reply to: Unable to set any breakpoints in a particular ESP-IDF project #21139KeymasterHi,
Thanks for the log file. Looks like VisualGDB incorrectly determines the path to the main binary built by the project. Please try this build: http://sysprogs.com/files/tmp/VisualGDB-5.4.3.2315.msi
Before opening the project, please enable debug logging in View->Other Windows->VisualGDB Diagnostics Console and then attach the debug output produced while opening the project. It should contain lines like “ESP-IDF code model: found xxx targets” listing the targets discovered from the esp-idf log.
KeymasterHi,
Yes, it looks like VisualGDB is checking for modified source/header files in your project and is trying to rebuild the preamble for the newly opened file. This results in reading many header files in a short succession, likely overloading the network connection you are using and delaying the main Visual Studio thread that is trying to access the source file.
Unfortunately there’s not much to optimize on our side though – VisualGDB needs to read all those files in order to build the necessary caches and if the network connection cannot handle this responsively, it would delay everything else. The good news is that VisualGDB only does this once after you open the solution. Once the necessary data is cached, VisualGDB won’t need to recompute/recheck it again.
Also storing the source code on the Windows side (or using the direct SSH access with the Advanced CMake Project Subsystem so that VisualGDB can prioritize file accesses internally) could speed this up.
KeymasterHi,
Good to know it works. We will unify the styles of the pages after we convert most of the settings pages to WPF (they will inherit the Visual Studio color theme just like the new wizards). Before that, the WPF-based pages and WinForms-based pages will indeed look slightly differently, sorry.
KeymasterHi,
No problem, please try this build: http://sysprogs.com/files/tmp/VisualGDB-5.4.3.2313.msi
KeymasterHi,
No problem, please try this build: http://sysprogs.com/files/tmp/VisualGDB-5.4.3.2312.msi
We have added support for specifying remote host in the “Custom GDB Stub” debug mode (requires the Custom edition or higher):
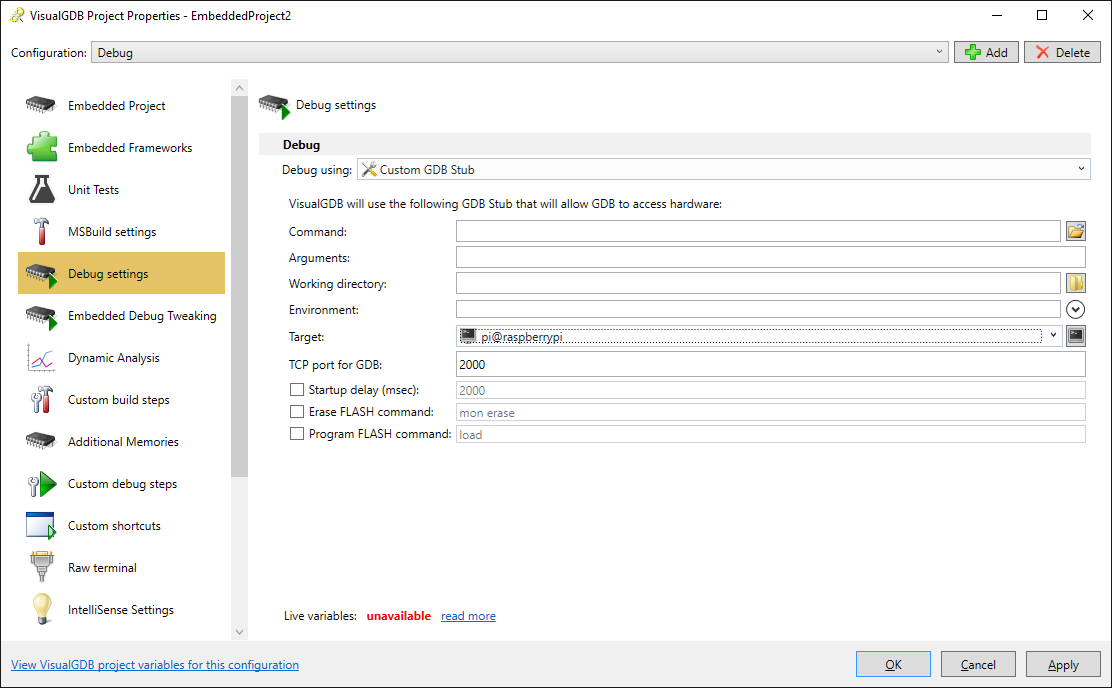
You should now be able to configure your embedded project to launch OpenOCD on Raspberry Pi.
Attachments:
You must be logged in to view attached files.KeymasterHi,
The visual issues you are describing come from the incompatibility between the WinForms framework used by older parts of VisualGDB and the modern high-DPI displays. We are gradually switching the VisualGDB GUI to the newer WPF framework that is 100% compatible with the new displays, so we only fix the legacy WinForms GUI if it becomes completely unusable.
That said, we have recently switched the Embedded Project Properties page to WPF, please try this build (please note that it is not 100% tested and may introduce new bugs).
If the VisualGDB Project Properties window is still too large on the first run, please check the %LOCALAPPDATA%\VisualGDB\GUIPreferences.xml file and let us know if there is any correlation between the LastKnownPropertyWindowRectangle values there and the window location/size (e.g. if the stored values appear multiplied by some factor).
KeymasterHi,
Great to hear you found the memory explorer useful. There’s not much else to suggest beyond that though – commercial compilers like Keil and IAR are known to produce much smaller code, however they are costly. The only other way to reduce the footprint would be to try optimizing your code.
June 15, 2018 at 02:00 in reply to: Unable to set any breakpoints in a particular ESP-IDF project #21116KeymasterHi,
If that’s the same project based on custom Makefiles (not following the regular ESP-IDF Makefile structure), many GUI features of VisualGDB won’t work properly (they rely on a specific Makefile structure of the regular ESP-IDF projects).
The breakpoint errors should be completely solvable though. Please use the “Diagnose Breakpoint Problems” button in the GDB Session window (it is explained in this tutorial, although it features an older VisualGDB version). If it doesn’t help, please create and share a full gdb log showing the exact commands sent while trying to set the breakpoints and we will advise you on the correct settings to fix this.
KeymasterHi,
No problem, we can help you with this. For MSBuild-based (and CMake-based) projects the .vgdbsettings file does not contain sufficient information to run the tests (e.g. the executable name is derived by MSBuild during compile time). VisualGDB solves this by caching those settings in a .vgdbtestcontainer file when you run the tests from the IDE.
Hence instead of running VisualGDB on the .vgdbsettings file, please run it on the .vgdbtestcontainer file as shown below:
VisualGDB /runtests <file.vgdbtestcontainer>
You can also configure VisualGDB to generate the test container file during the regular build (see the Generate a test container file property in VS Project Properties).
KeymasterHi,
Sorry, we are not able to 100% confirm it at this point. It will include the sources and examples from the original Nordic SDK, so if the mesh SDK is included in it (and works out-of-the-box), it will likely get included as well. Otherwise it would need to be treated as an external dependency.
-
AuthorPosts