Today we are excited to announce the second preview of VisualGDB 5.3 that introduces several improvements to the Clang IntelliSense engine. In this post I will show you the highlights of the new engine.
Performance Improvements
One of the most frequent feedback we received on the Clang IntelliSense was relatively slow performance for huge projects. So we made the VisualGDB 5.3 IntelliSense engine automatically diagnose the parsing bottlenecks and offers ways of improving the performance. If you ever run into slow performance with Clang IntelliSense, click the timing button in the top right corner of the source file: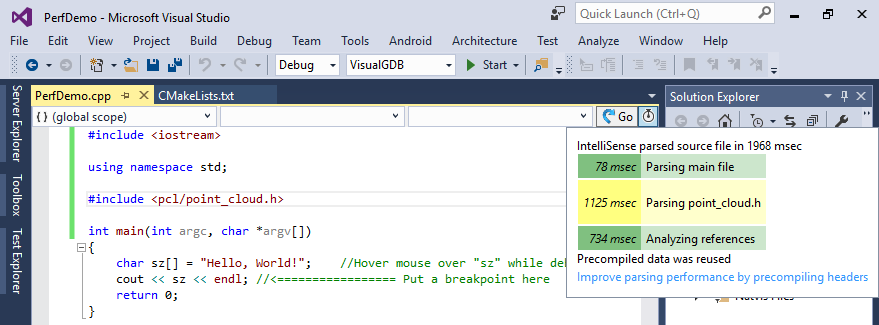
If will show where exactly did the time go and will suggest easy ways to improve the parsing speed. E.g. if your sources intermix #include<> directories with other code so the included headers don’t get automatically precompiled, you can click the “Precompile headers” link and quickly setup an IntelliSense-only precompiled header file that will include the heaviest headers. Once it gets precompiled, IntelliSense won’t spend much time reparsing those headers again.
Another source of slowness was the “Analyzing References” stage that cross-referenced the source file to ensure instant operation of “Go to definition” and “Find all references”. With huge files including many headers, analyzing all references in all headers could take too much time. If this ever happens now, VisualGDB will offer enabling lightweight reference analysis mode that will skip the heavy analysis unless you are explicitly searching for all references: 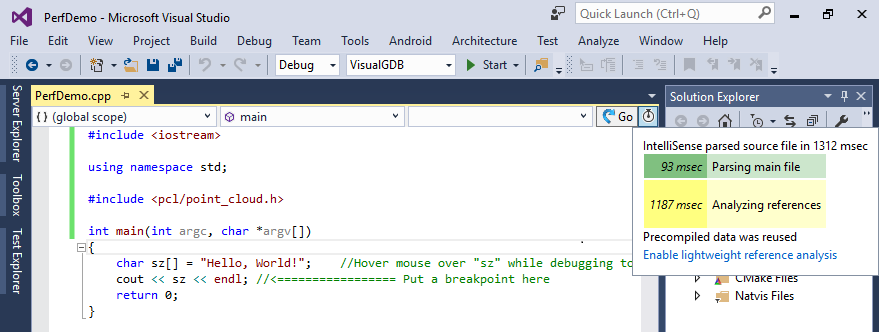
We have also made the “Go to definition” command more tolerant to changes in common header files. Large-scale updates to your code base will no longer trigger the lengthy rebuild of the IntelliSense cache if the Clang engine manages to locate the correct source file using the old cache and only rebuild that single file.
Smart Integrated Comments
If you are using Doxygen to document your code, we’ve got good news for you. Typing “//!” or “/*!” in front of a function/method declaration will automatically generate a structured comment block with templates for function arguments and return value description: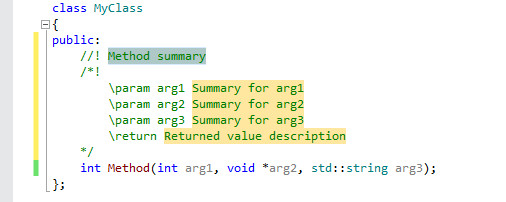 This feature is powered by Visual Studio Code Snippet mechanism, so you can conveniently jump between different parts of the generated comment by pressing <TAB>. The comment templates are fully customizeable and can be changed by editing files in C:\Program Files (x86)\Sysprogs\VisualGDB\CommentTemplates.
If you are using markers like TODO in your comments, VisualGDB will now automatically recognize them in your source files and will display them in the Tasks window: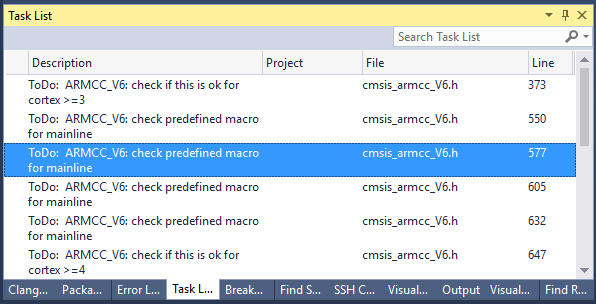
You can tell VisualGDB the exact list of keywords to look for and choose whether you want to load the comments from open files only, like the regular Visual C++ does, or scan the entire project: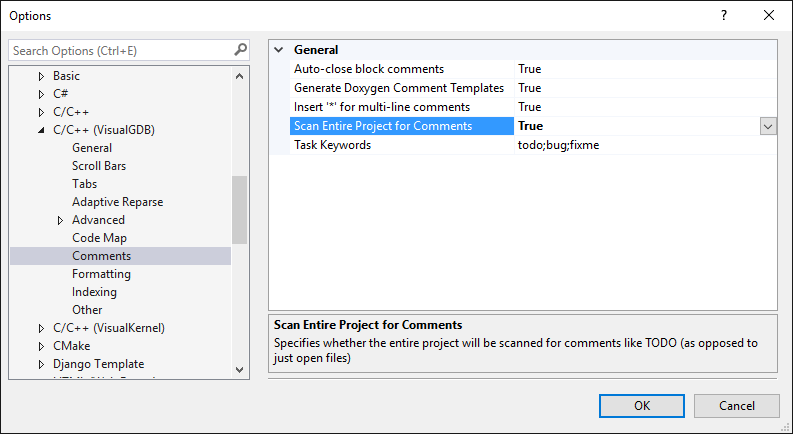
Other Improvements
We have also introduced many small improvements requested by our users. Clang IntelliSense now fully supports the Peek Definition command: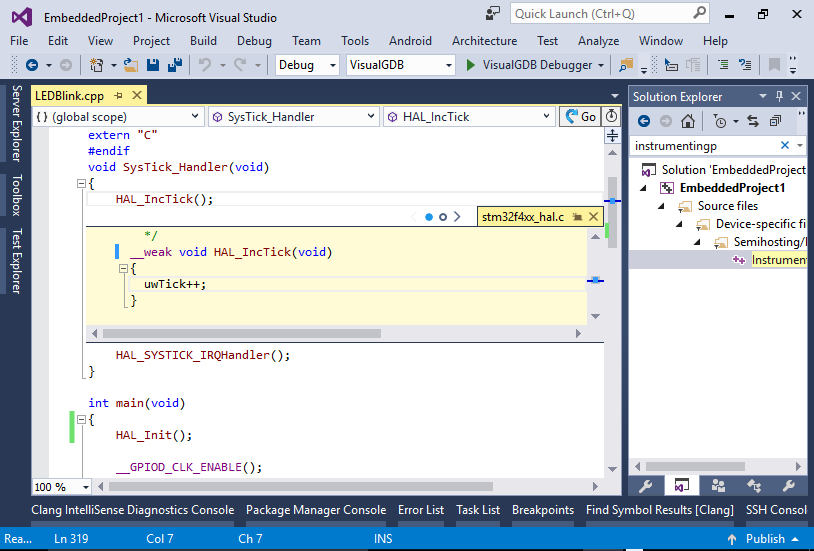
Overriding base class methods now works just like in C#: type “override” inside the class definition, select a method to override and VisualGDB will automatically generate a declaration and an empty definition for it:
Managing warnings is now easier as well, just select “Ignore this instance of the issue” in the smart tag menu and VisualGDB will automatically insert a “#pragma GCC diagnostic” block around the offending line:
Advanced CMake Project Improvements
The new Preview 2 build contains several improvements to the new CMake Project Subsystem including better sorting of targets coming from multiple projects, improved support for remote projects accessed directly over SSH and convenient menu commands to build individual directories: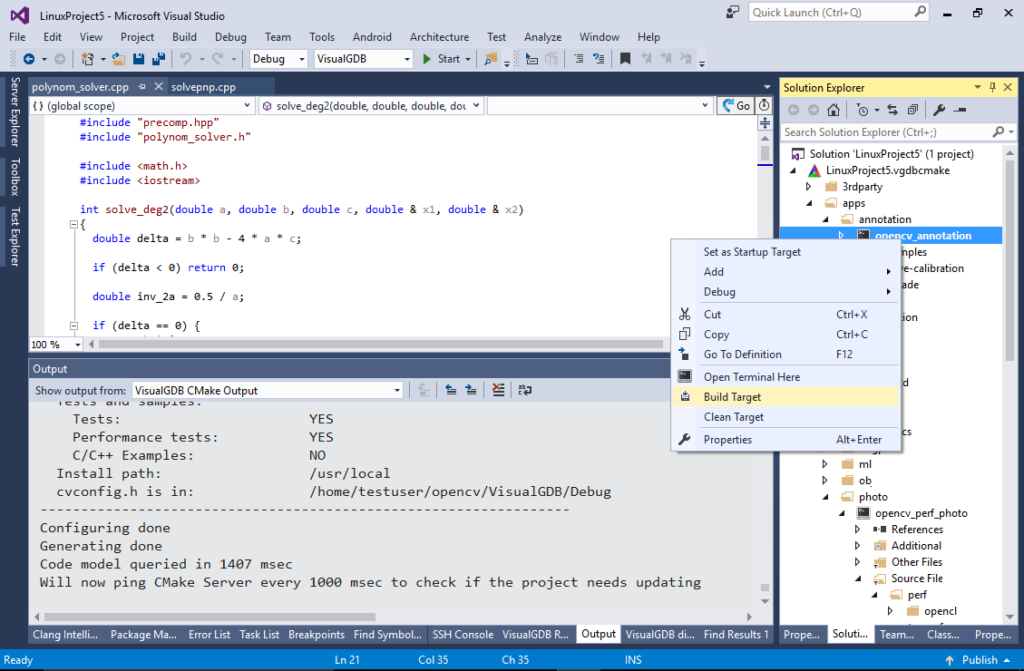
Try it out
VisualGDB 5.3 Preview 2 is out. Try it out today and don’t forget to send us your feedback via the support interface or our forum. Enjoy!