Today we are excited to announce the release of VisualGDB 5.4 Preview 3 that adds support for tracing ARM devices with Segger J-Trace. Tracing is a powerful debugging technique that lets you track each and every instruction executed by the target CPU without ever stopping it, or instrumenting any code.
In this post I will show you how to use tracing to step back in time, reconstructing the code path leading to an otherwise untraceable crash and how to see the code coverage for your embedded projects in real time and without any instrumentation overhead.
Tracing requires using special a hardware probe – Segger J-Trace Pro. It combines a regular JTAG/SWD debugger with a special interface that can read the tracing data directly from your microcontroller. Once the trace mode is enabled, your device will output a special compressed log via the TRACEDATA and TRACECLK pins, allowing the debug software to reconstruct each instruction that was executed by the MCU. Unlike software instrumentation, this does not incur a major slowdown, although it requires the J-Trace probe in order to capture and interpret the tracing data.
In order to try ARM tracing with VisualGDB, install Segger Software Pack v6.32 or later, VisualGDB 5.4 Preview 3 or later and update your Segger Debug plugin via VisualGDB Package Manager. Once you do that, go to the Embedded Debug Tweaking page of VisualGDB Project Properties and enable real-time tracing there: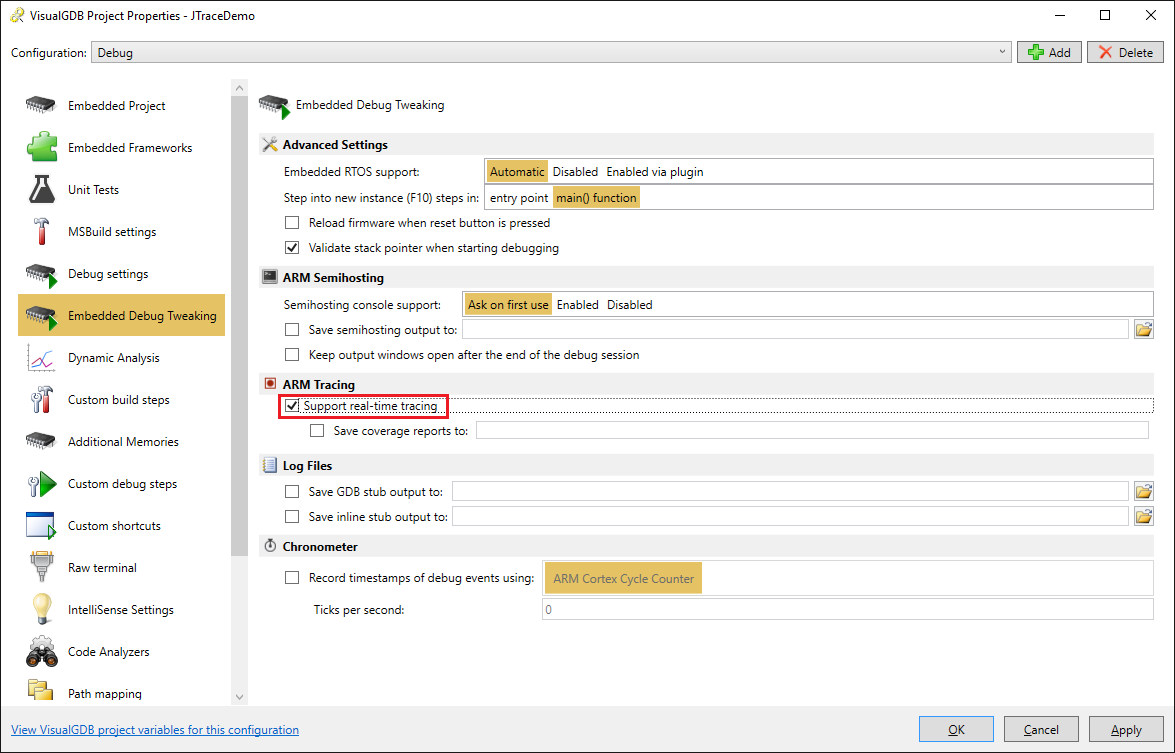 This will activate the Live Tracing mode next time you are debugging. It will show detailed statistics on the executed functions and will also compute code coverage for them:
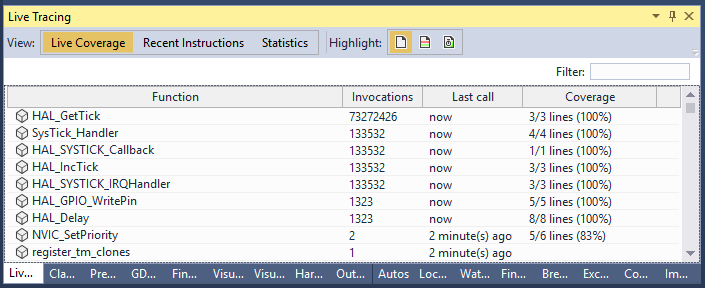 If you are using Visual Studio 2013 or later and have the Clang IntelliSense enabled, you can enable the dynamic highlighting of the currently executed code. Unlike periodic probing of the $pc register, this will highlight every line that was physically executed in the last few seconds:
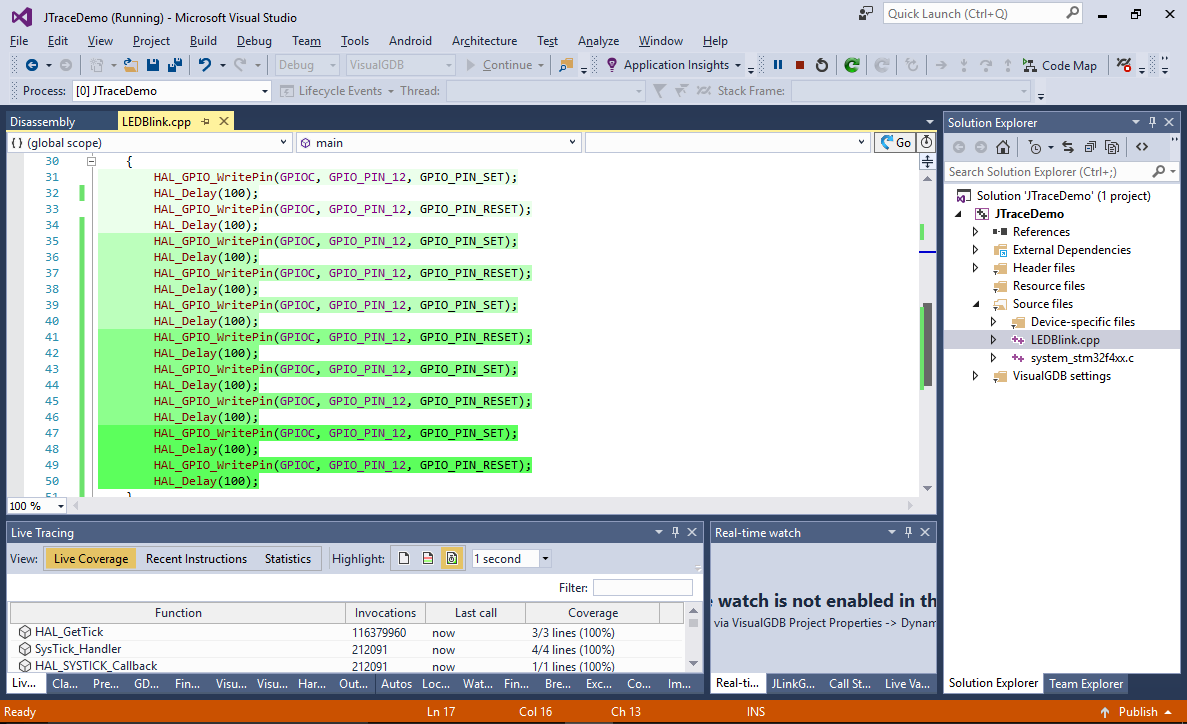 Alternatively you can just highlight the lines based on whether they were executed in this debugging session, letting you easily spot dead code:
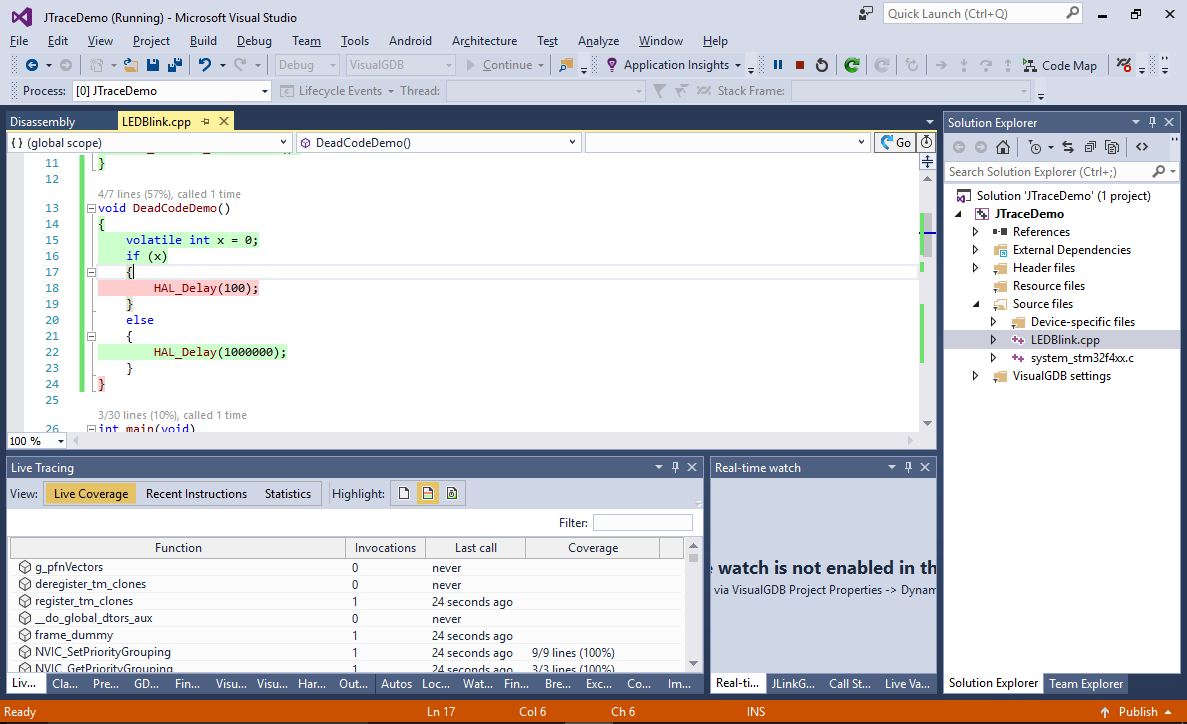
Diagnosing Tough Crashes
Another great use for tracing is diagnosing tough crashes where the stack/register corruption makes it hard to pinpoint the culprit. Consider this code:
void badfunc() { register void **sp asm("sp"); register void *lr asm("lr"); extern void *_estack; for (int i = 0; i < 32 && sp < &_estack; i++) { asm("nop"); *sp++ = (void *)0; } lr = (void *)0xFFFFFFFF; } |
Once the badfunc() erases the stack contents, replaces the $lr register and returns, the program will stop at an exception handler with a pretty useless call stack: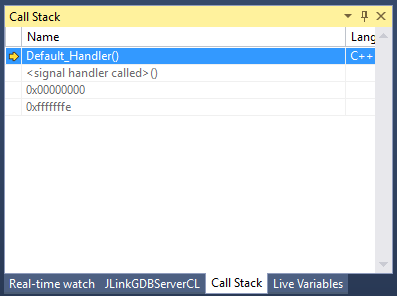
The conventional way of tracking this type of problem would involve commenting out parts of your code in hope to pinpoint the part triggering the crash, but tracing simply lets you step back in time, recovering the events before the crash line-by-line: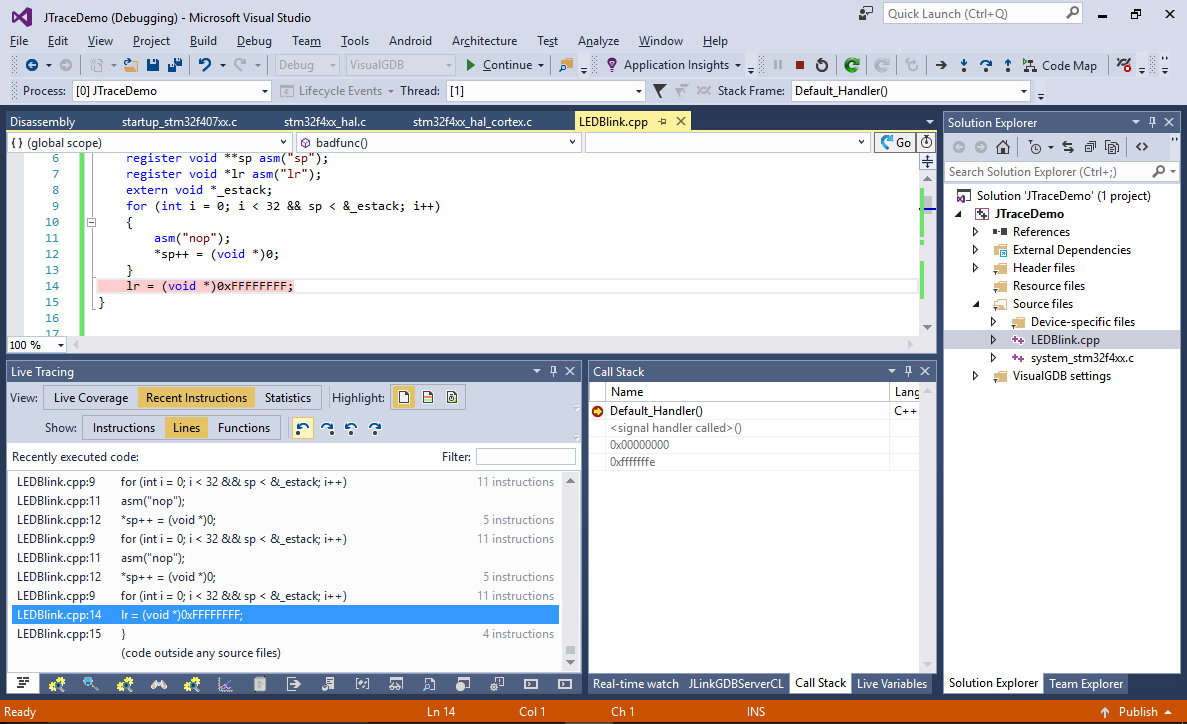
You can also choose to track individual instructions or functions if the line view is not informative enough.
Stay Tuned
We are working with Segger on bringing the J-Trace integration even further, supporting profiling, bottleneck analysis and a zero overhead version of the Real-Time Watch. Follow us on Twitter to stay tuned. And as always, we would love to hear your feedback, so if you have any suggestions or bugs to report, do not hesitate to contact us via the support form or forum.