Today we happy to announce the final release of VisualGDB 5.3. Over the past several months and 8 preview builds we have introduced and fine-tuned multiple usability-focused improvements to your cross-platform development workflow and I will give you a quick overview of them in this post.
Advanced CMake Project Subsystem
VisualGDB has been supporting CMake for a while. However the new v5.3 brings this support to a new level. The new Advanced CMake Project Subsystem can be used instead of the regular Visual C++ project system, mapping the structure of the CMake files directly into Visual Studio: visualizing targets and settings and automatically editing CMakeLists.txt files in response to your interaction with Visual Studio GUI: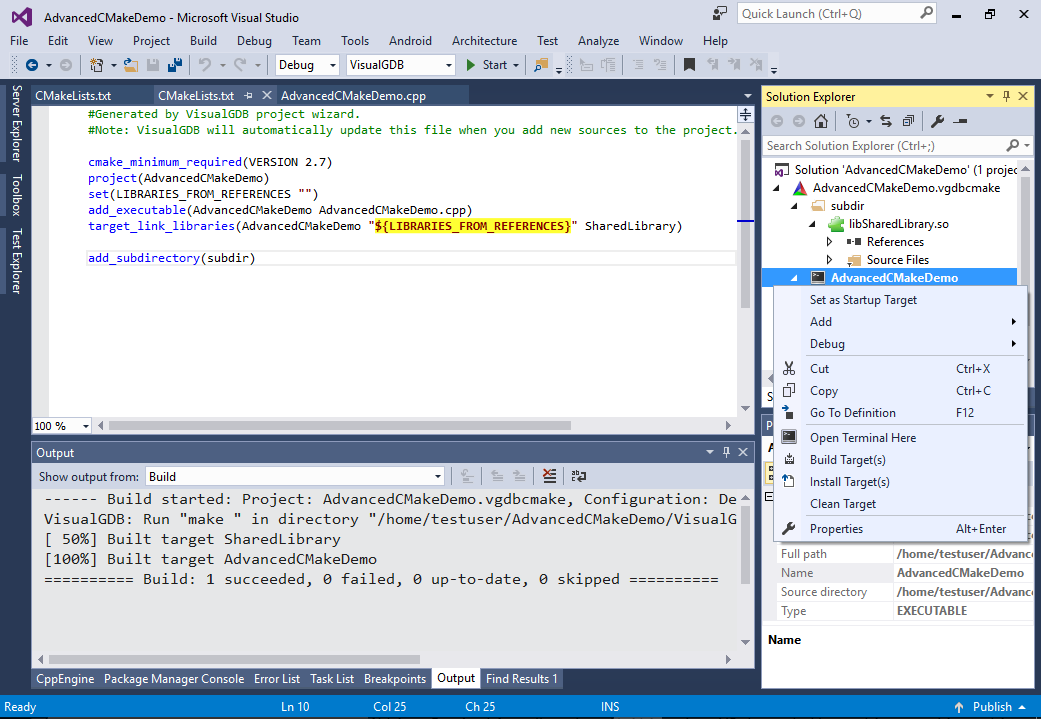
Direct SSH file access
Previous versions of VisualGDB could upload your source files to the Linux machine before building, or help you setup shared folders. The new VisualGDB 5.3 introduces a new “vgdb-ssh://” file URL format and lets you open, edit and build your projects directly on the Linux machine over SSH without importing anything locally: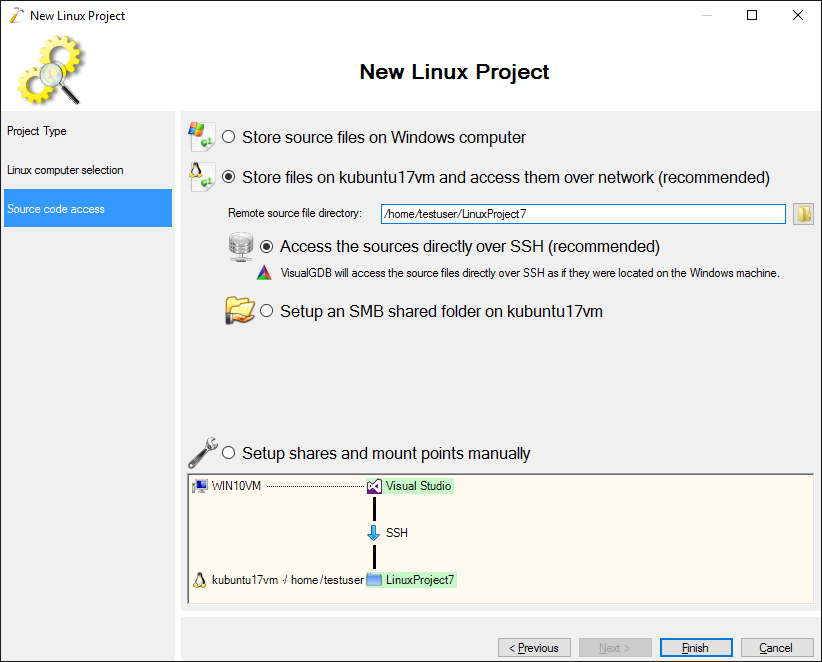
This eliminates synchronization issues and makes setup straight-forward, although it only works with the new Advanced CMake Projects.
Embedded Debugging Usability
In VisualGDB 5.3 we have significantly redesigned the usability of the embedded debug GUI. VisualGDB can now distinguish individual instances of programming interfaces (like ST-Link) and identify them by serial numbers, will show progress when programming FLASH memory with OpenOCD and will diagnose common errors and show meaningful messages helping you quickly understand the underlying problem: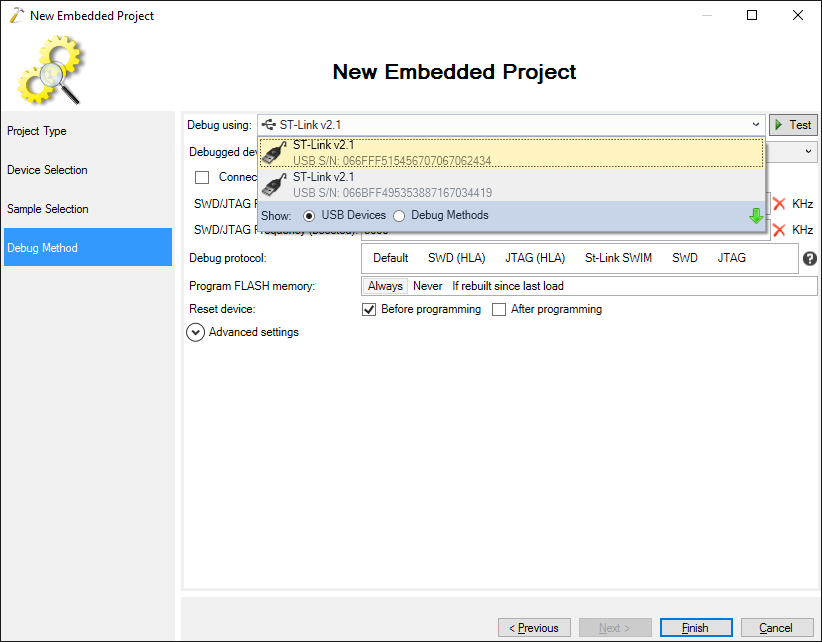
New Toolchain Engine
VisualGDB 5.3 includes a new toolchain and BSP engine that supports installing multiple versions of the same toolchain or BSP (Custom edition and higher), provides convenient variables to avoid hardcoding toolchain/BSP paths in the project files or VisualGDB settings files and makes the toolchain management generally more intuitive: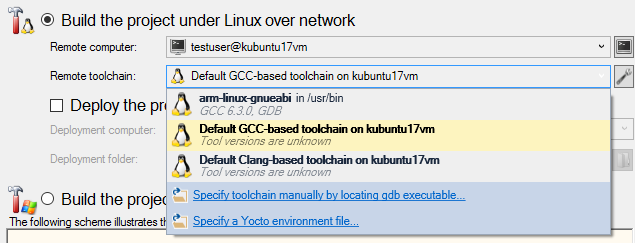
Profiling of Linux Programs
VisualGDB 5.3 supports profiling of Linux programs using Valgrind and a powerful analytics engine built on top of it. Simply start profiling via Analyze->Analyze performance with VisualGDB and enjoy detailed instantly searchable per-function and per-line reports on your code performance, or use them to explore the actual relations between functions involved in handling a complex case: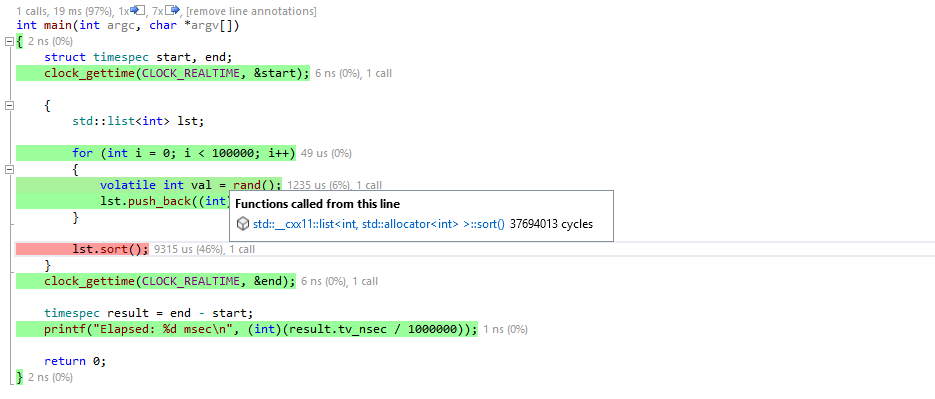
Better integration with STM32CubeMX
In recognition of the growing popularity of the STM32 devices, VisualGDB now supports importing STM32CubeMX projects out-of-the-box. Simply point to a gpdsc file generated by STM32CubeMX and VisualGDB will automatically convert it into a Visual Studio project and will automatically update it if the original gpdsc project changes: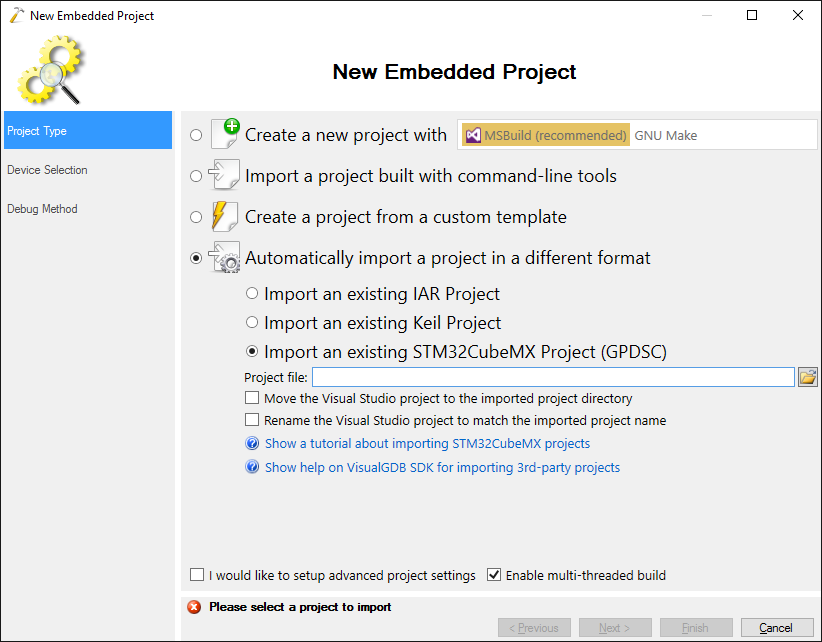
Static and dynamic code analysis
VisualGDB 5.3 also supports static code analysis powered by Clang and dynamic code analysis of Linux projects powered by Valgrind (Custom edition and higher). 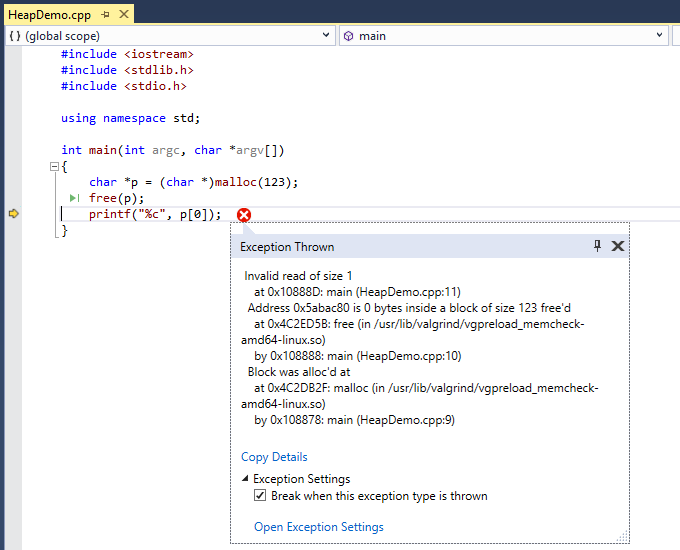
Embedded Integration Tests
If adding a unit test framework to your embedded project sounds like too much work, VisualGDB offers a much more lightweight solution to keep your code health in check. Simply use the debugger to alter your program behavior, record its responses and insert checks validating the return codes, function execution times and the order of events: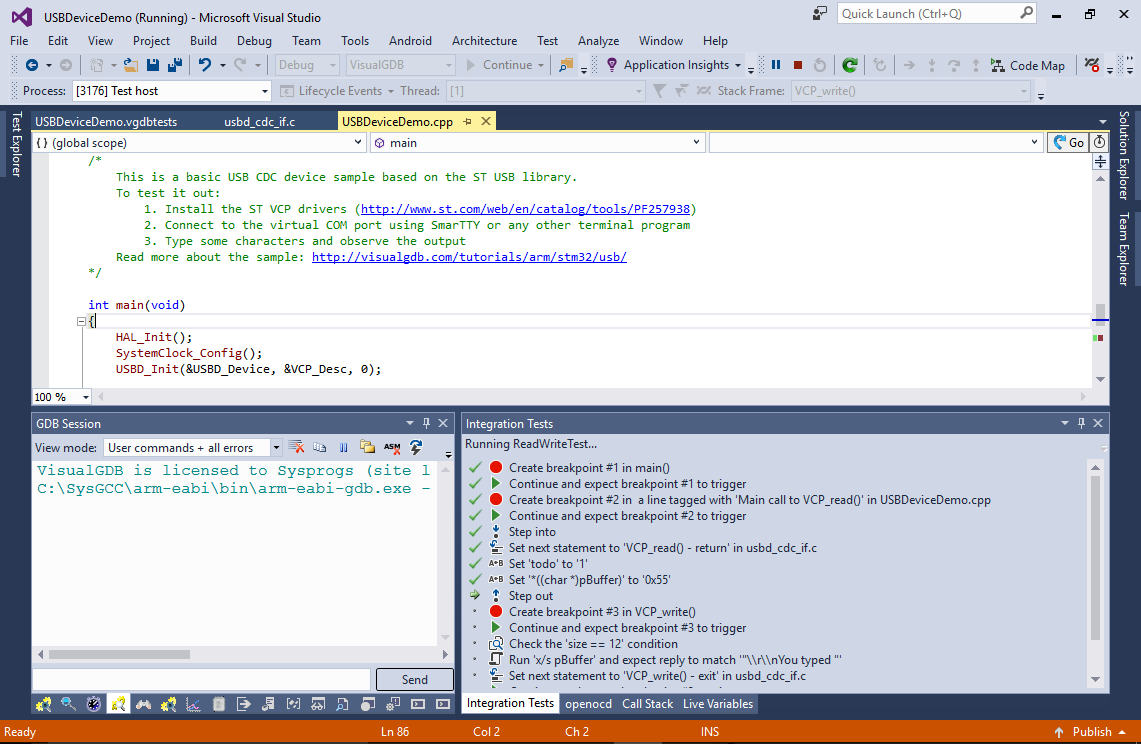
Test coverage for Linux tests
VisualGDB 5.3 supports integration with gcov. Simply enable coverage instrumentation via VisualGDB Project Properties and you will be able to see detailed reports on covered functions, blocks and lines for both remotely built projects and projects using a cross-compiler: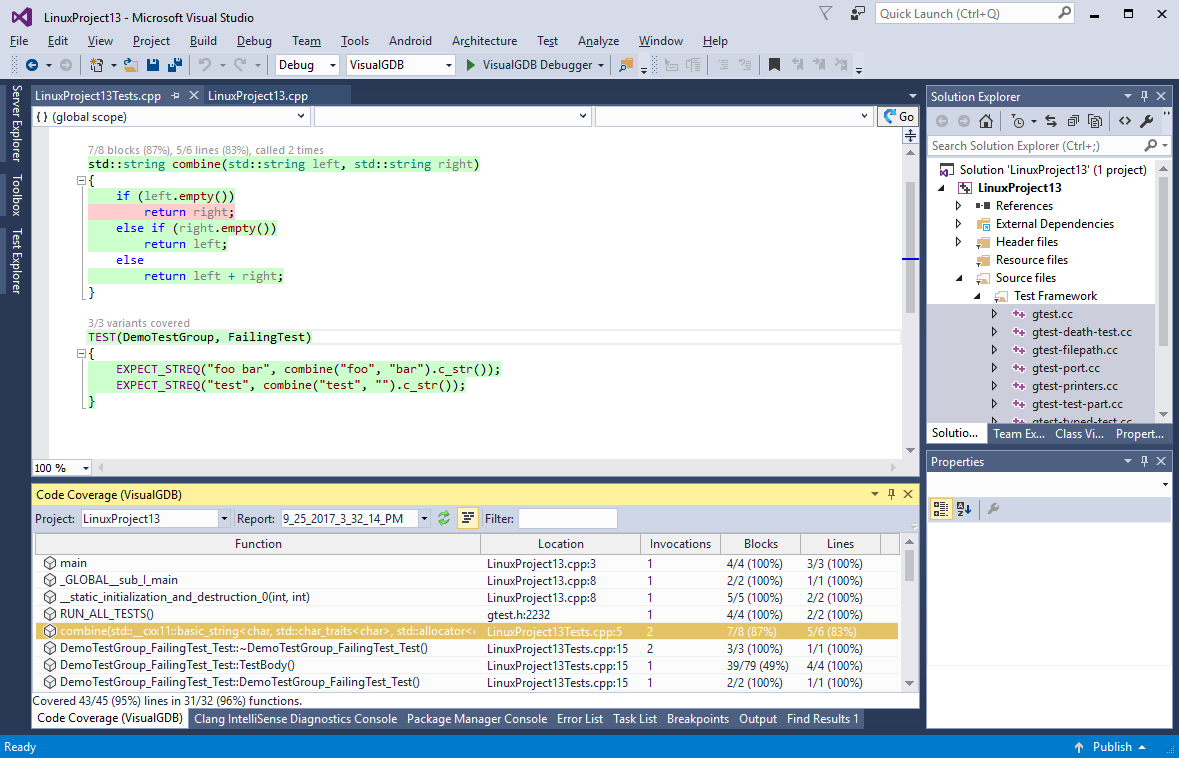
Team Settings Engine
If you ever had to synchronize VisualGDB settings like toolchain definitions between multiple machines, we have good news for you. The new Team Settings Engine lets you instantly publish common settings to a shared folder on your network and immediately make them available to other team members: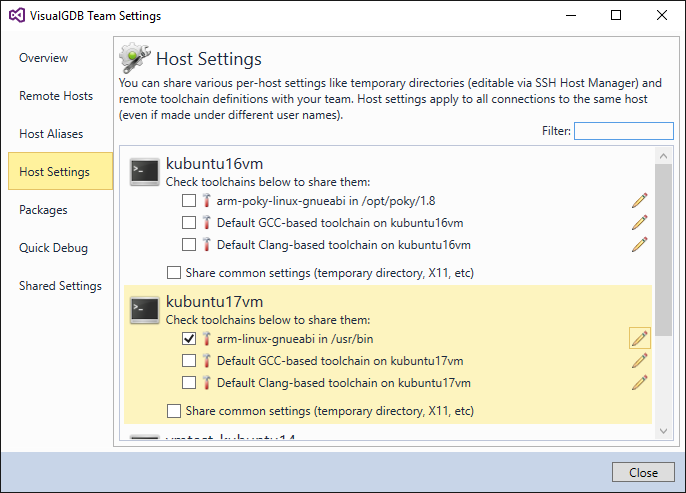
This feature works on top of the regular Windows file permissions and uses intuitive XML files to store the shared settings, so you can check them in under source control and track the changes.
Bonus: Updated GUI
If you have tried VisualGDB 5.3 (or RC) before, don’t forget to update to the final release. It includes numerous small improvements to various components and better WPF-based versions of several common user interfaces that had known issues on high-DPI screens: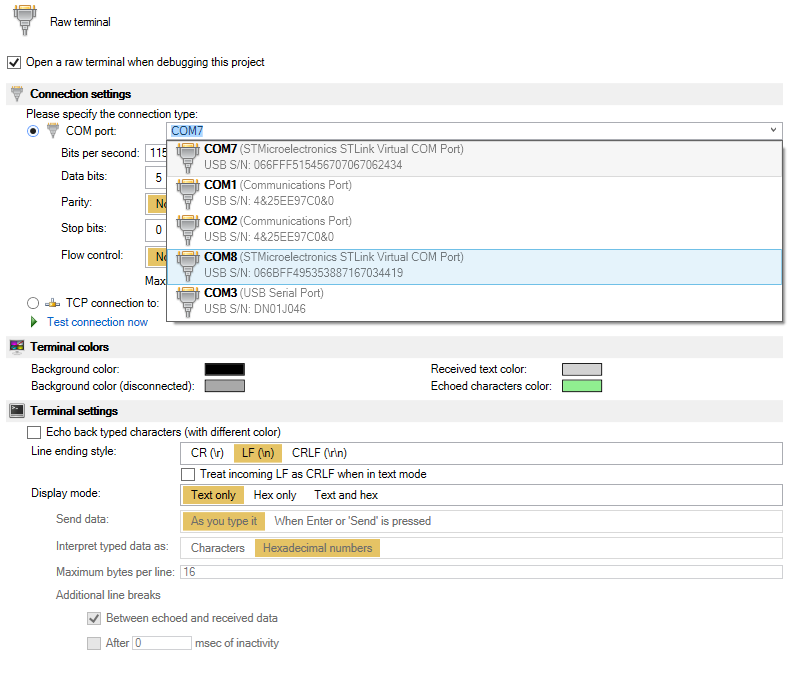
You can find a detailed list of changes in the changelog.
Try it out
VisualGDB 5.3 is out. Give it a try here and don’t hesitate to send us your feedback via the support page or forum.