Sysprogs forums › Forums › VisualGDB › Stepping over/through std::shared_ptr
- This topic has 6 replies, 2 voices, and was last updated 8 years, 3 months ago by
support.
-
AuthorPosts
-
December 27, 2017 at 21:41 #13344
BitFlipper
ParticipantI think this might have been discussed previously but I can’t find the answer after searching for a while. Basically, I want to step through/over a std::shared_ptr (and other C+ classes and containers) as if it is just a regular pointer. I believe I might need to modify VS xml file used for the “step into specific” functionality, but not sure.
E.G.:
std::shared_ptr<std::string> strPtr = std::make_shared<std::string>("Hello");What I need in this case is strPtr._M_ptr, which is a pointer to the underlying type.
So how would I get VS to recognize a shared_ptr as a regular pointer? And also, for the above example, if I type:
strPtr->
…VS intellisense should know what members std::string has and list them.
Note I’m not using native VS intellisense.
Thanks in advance for any help.
-
This topic was modified 8 years, 3 months ago by
BitFlipper.
December 27, 2017 at 22:27 #13346BitFlipper
ParticipantI guess I need to use the Natvis support in VS, however I can’t get it to work after trying a few times. Can someone provide an example of what a Natvis file would look like that properly shows a std::shared_ptr<>?
December 28, 2017 at 03:53 #13348BitFlipper
ParticipantNote I’m not using native VS intellisense.
I should clarify since I made a typo above, I am using native VS intellisense, not Clang intellisense. Not sure if it matters either way.
December 28, 2017 at 06:03 #13349BitFlipper
ParticipantI got the natvis visualizer to more or less work with the following:
<Type Name="std::shared_ptr<*>"> <DisplayString Condition="_M_ptr == 0">null</DisplayString> <DisplayString Condition="_M_ptr != 0">{*_M_ptr}</DisplayString> <Expand> <Item Condition="_M_ptr != 0" Name="[ptr]">_M_ptr</Item> </Expand> </Type>It works for things like shared_ptr<int> and shared_ptr<MyClass>, however it doesn’t work with shared_ptr<string>. Strangely, a string by itself works (i.e. it shows the string contents while hovering over a string variable), but shared_ptr<string> doesn’t display the string value properly.
The full string type is:
std::__cxx11::basic_string<char, std::char_traits<char>, std::allocator<char>>
Is there an issue with making it work with nested template types, or am I just doing it wrong?
-
This reply was modified 8 years, 3 months ago by
BitFlipper.
December 29, 2017 at 05:48 #13352support
KeymasterHi,
Sorry, this is a known issue (priority conflict between natvis engine and the C# visualizer API). We will try to address this is one of the next maintenance releases. As a workaround, please consider creating a basic visualizer using the C# API as described here: https://visualgdb.com/w/tutorials/visualizergettingstarted/
December 29, 2017 at 17:18 #13357BitFlipper
ParticipantOK thanks for confirming. I’ll take a look at your C# visualizer API.
Can you also maybe clarify about the “stepping through” issue. I realize this might be a completely different issue. Basically, when I have something like a shared_ptr<MyClass> instance, and I step through/into the code, I want to step directly into methods inside the MyClass instance, not first have to step through the shared_ptr member functions before getting into the MyClass members.
January 2, 2018 at 20:46 #13361support
KeymasterHi,
No problem, we will explain how the “Step into specific” functionality works.
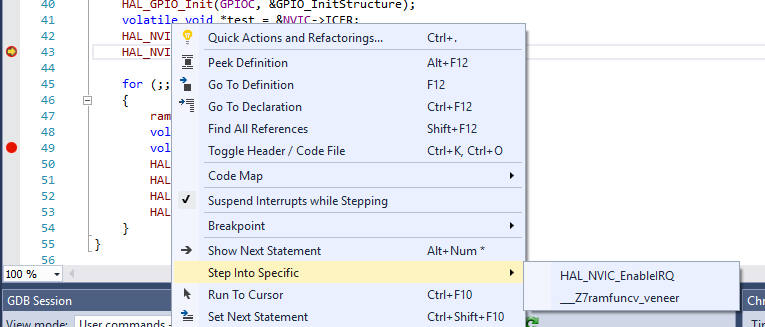
First of all, VisualGDB doesn’t support “blacklisting” functions for automatic stepping through them yet (we will try to add this in one of the next releases), however it supports the “Step into specific” command as shown below:

Normally it should work out-of-the-box, however if it doesn’t, you can fine-tune it by editing the StepIntoSpecific.xml file in the VisualGDB directory. The Step Into Specific feature works by disassembling the instructions corresponding to the active line in code and searching for the patterns defined in StepIntoSpecific.xml. Once a pattern is found, the corresponding label will be shown in the “Step into specific” menu and once you select it, VisualGDB will set a breakpoint at that instruction and then do a single “step in” step.
If it doesn’t work as expected and you are not sure how to adjust it, please let us know the details (i.e. your code and the output from the GDB Session window showing VisualGDB disassembling the current line) and we will help you get it to work.
Attachments:
You must be logged in to view attached files. -
This topic was modified 8 years, 3 months ago by
-
AuthorPosts
- You must be logged in to reply to this topic.