Sysprogs forums › Forums › VisualGDB › Microchip WLR089 Support
- This topic has 11 replies, 2 voices, and was last updated 1 year, 7 months ago by
support.
-
AuthorPosts
-
August 21, 2024 at 11:49 #35889
Matt
ParticipantHow can I use the Microchip WLR089 (SAMR34) in VisualGDB?
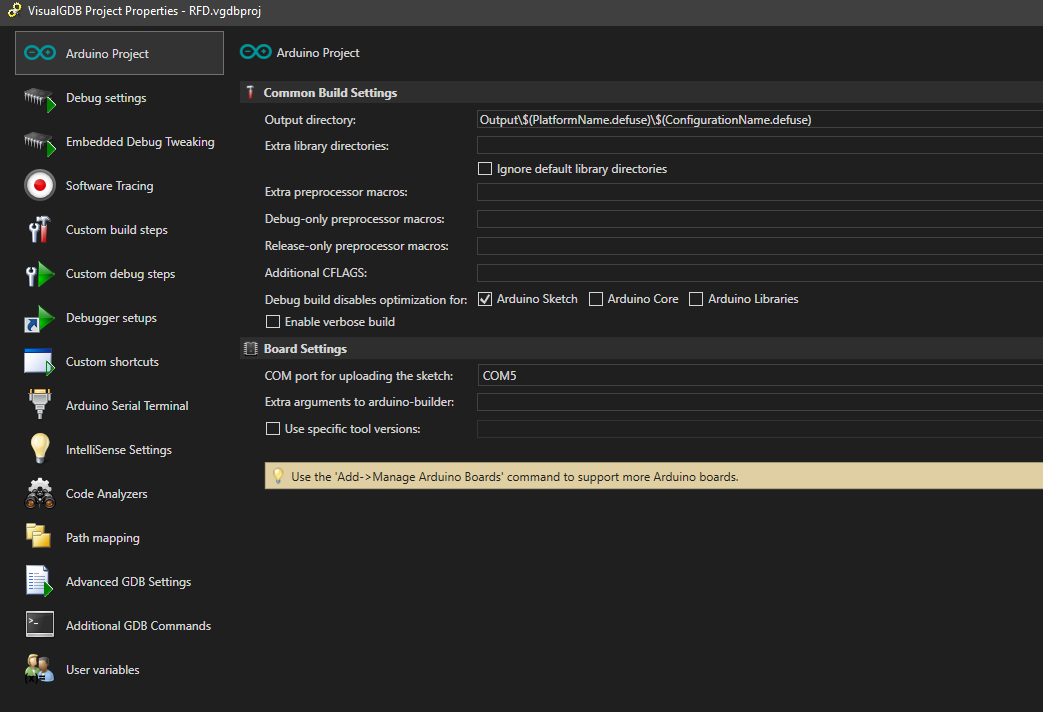
I have managed to actually get the Arduino platform for it to compile well, but I cannot debug (or upload the binary object by the J-Link). I read that I needed to upgrade to the Ultimate Edition (which I just did) in order to gain access to specifying the external memory, but I don’t see that option in my list (image attached).
The error I get when trying to debug/upload is this
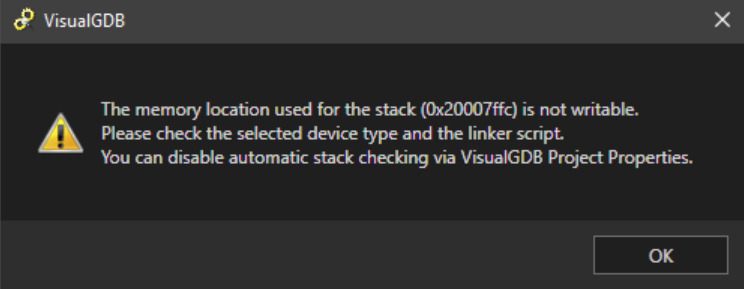
Any help would be appreciated. If I don’t need the Ultimate Edition because it doesn’t work with the Arduino stuff, I’d like a refund please.
-
This topic was modified 1 year, 7 months ago by
Matt.
-
This topic was modified 1 year, 7 months ago by
Matt.
-
This topic was modified 1 year, 7 months ago by
Matt.
-
This topic was modified 1 year, 7 months ago by
Matt.
Attachments:
You must be logged in to view attached files.August 21, 2024 at 12:16 #35896support
KeymasterHi,
The “Easy GUI for managing additional memories” in the Custom edition refers to this feature. It provides a GUI for adding memories and associated sections to linker scripts instead of editing them manually. It only works for classic embedded projects (not Arduino/Mbed/ESP-IDF). If you do not need this feature, or any other Custom/Ultimate features, you can contact our support, and we will revert the upgrade.
If you would like to get debugging working on WLR089, please make sure Segger J-Link actually supports it and can work with it via command line (by launching their gdbserver manually). If J-Link cannot communicate to the chip, using VisualGDB on top of it won’t automatically fix it.
August 21, 2024 at 21:55 #35902Matt
ParticipantIt seems that the Segger J-Link is working fine. How can we try to resolve this issue?
August 21, 2024 at 23:14 #35903support
KeymasterPlease make sure you can run the J-Link gdb server manually, connect gdb to it and debug the ELF file produced by the Arduino project.
Once this works, feel free to share the details (e.g. exact J-Link gdb server command line that worked), and we can help you configure VisualGDB to replicate that setup.
August 22, 2024 at 07:08 #35904Matt
ParticipantDo I need to use GDB? I have J-Link selected in VisualGDB and that should work as intended shouldn’t it??
Here is the log from J-Link commander if it helps. It shows that I can in fact connect to the MCU. Halting, resetting, etc all works fine.
SEGGER J-Link Commander V7.96l (Compiled Jun 12 2024 18:56:19)
DLL version V7.96l, compiled Jun 12 2024 18:55:26
Connecting to J-Link via USB...O.K.
Firmware: J-Link EDU Mini V1 compiled May 28 2024 15:38:10
Hardware version: V1.00
J-Link uptime (since boot): 6d 20h 47m 50s
S/N: 123456789
License(s): FlashBP, GDB
USB speed mode: Full speed (12 MBit/s)
VTref=3.294V


Type "connect" to establish a target connection, '?' for help
J-Link>connect
Please specify device / core. <Default>: ATSAMR34J18
Type '?' for selection dialog
Device>
Please specify target interface:
J) JTAG (Default)
S) SWD
T) cJTAG
TIF>S
Specify target interface speed [kHz]. <Default>: 4000 kHz
Speed>
Device "ATSAMR34J18B" selected.

Connecting to target via SWD
InitTarget() start
InitTarget()
InitTarget() end - Took 2.95ms
Found SW-DP with ID 0x0BC11477
DPIDR: 0x0BC11477
CoreSight SoC-400 or earlier
Scanning AP map to find all available APs
AP[1]: Stopped AP scan as end of AP map has been reached
AP[0]: AHB-AP (IDR: 0x04770031)
Iterating through AP map to find AHB-AP to use
AP[0]: Core found
AP[0]: AHB-AP ROM base: 0x41003000
CPUID register: 0x410CC601. Implementer code: 0x41 (ARM)
Found Cortex-M0 r0p1, Little endian.
FPUnit: 4 code (BP) slots and 0 literal slots
CoreSight components:
ROMTbl[0] @ 41003000
[0][0]: E00FF000 CID B105100D PID 000BB4C0 ROM Table
ROMTbl[1] @ E00FF000
[1][0]: E000E000 CID B105E00D PID 000BB008 SCS
[1][1]: E0001000 CID B105E00D PID 000BB00A DWT
[1][2]: E0002000 CID B105E00D PID 000BB00B FPB
[0][1]: 41006000 CID B105900D PID 001BB932 MTB-M0+
Memory zones:
Zone: "Default" Description: Default access mode
Cortex-M0 identified.
-
This reply was modified 1 year, 7 months ago by
Matt.
-
This reply was modified 1 year, 7 months ago by
Matt.
-
This reply was modified 1 year, 7 months ago by
Matt.
Attachments:
You must be logged in to view attached files.August 22, 2024 at 07:47 #35911Matt
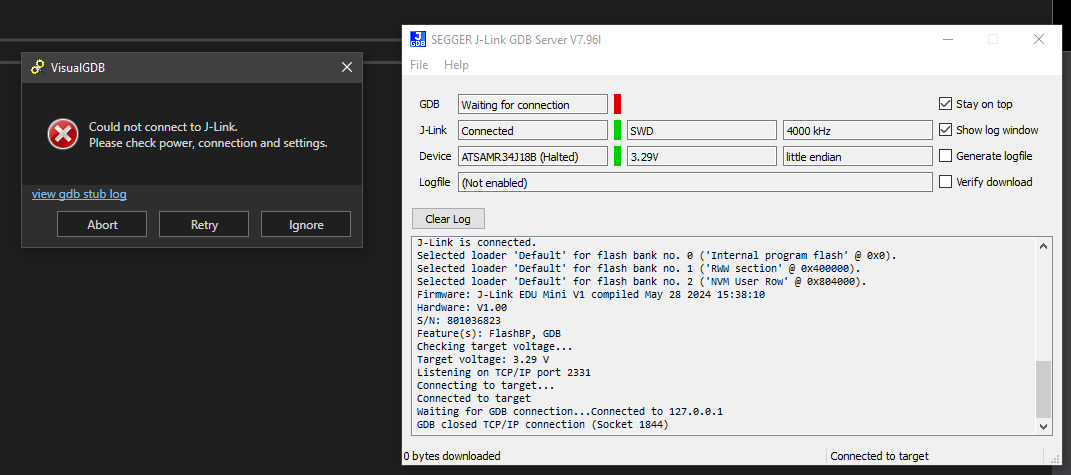
ParticipantAs a test, I tried running J-Link GDB directly and under VisualGDB using TCP/IP instead of USB, but I cannot change the port. It’s always something random! In this case, 44565.
J-Link GDB is listening on port 2331 and if I set the “Remote IP address” field to 127.0.0.1:2331 to force the port, it connects but then drops it instantly.C:\Program Files (x86)\SEGGER\JLink\JLinkGDBServerCL.exe -select IP=127.0.0.1:2331 -device ATSAMR34J18 -speed auto -if SWD -port 44565 SEGGER J-Link GDB Server V6.60 Command Line Version JLinkARM.dll V6.60 (DLL compiled Dec 16 2019 15:10:44) Command line: -select IP=127.0.0.1:2331 -device ATSAMR34J18 -speed auto -if SWD -port 44565 -----GDB Server start settings----- GDBInit file: none GDB Server Listening port: 44565 SWO raw output listening port: 2332 Terminal I/O port: 2333 Accept remote connection: localhost only ...
-
This reply was modified 1 year, 7 months ago by
Matt.
Attachments:
You must be logged in to view attached files.August 22, 2024 at 08:28 #35914support
KeymasterHi,
There are 2 different ports involved in it. The one passed via -select refers to connecting JLinkGDBServer to J-Link hardware via TCP/IP (as opposed to USB). The one passed via -port refers to the port used by gdb to connect to JLinkGDBServer.
You can try clicking the “test” button on the Debug Settings page of VisualGDB Project Properties. It will launch the J-Link GDB server and will show the used command line. You can then try closing it, running it manually, and then starting GDB (pointing it to the correct ELF file) and running the following commands:
target remote :<GDB port specified via -port>
load
b main
continue
If this works (i.e. breakpoint in main() triggers), but debugging with VisualGDB still doesn’t work, please attach the gdb log from VisualGDB along with the output from running the gdb commands manually, and we will help you find the difference.
August 22, 2024 at 08:46 #35915Matt
ParticipantI already included the “test” button log for you. It’s called “JLinkGDBServerCL.exe -select IP=127.0.0.1:2331 -device ATSAMR34J18 -speed auto -if SWD -port 44565”.
If I run it manually but with the correct port, it shows the following.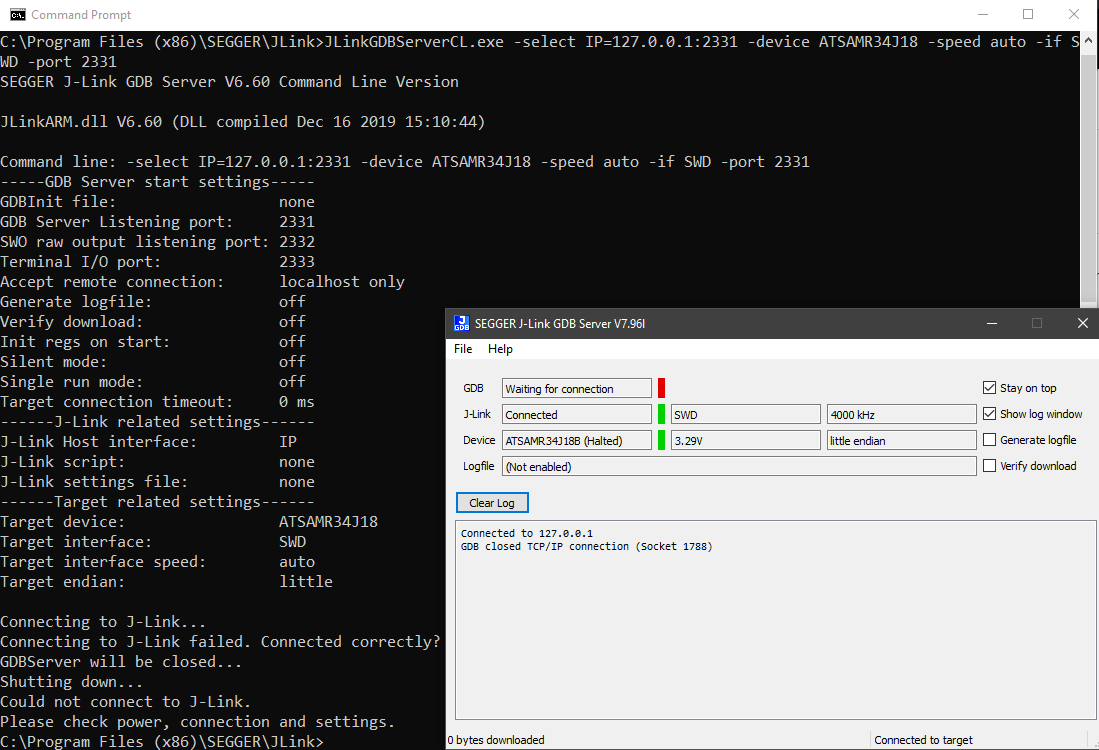
If I remove “-select IP=127.0.0.1:2331” from the command argument, I get the following
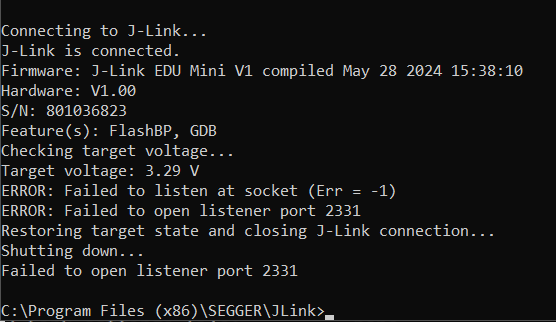
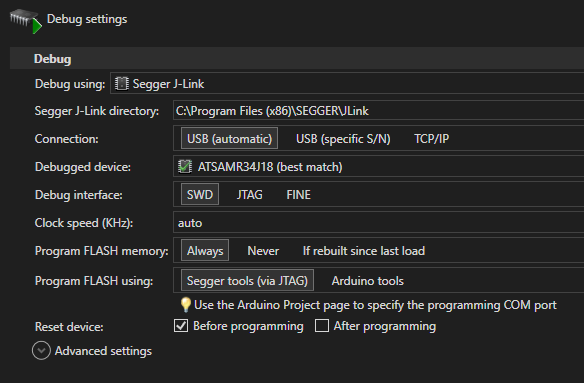
And for reference, this is my J-Link GDB config
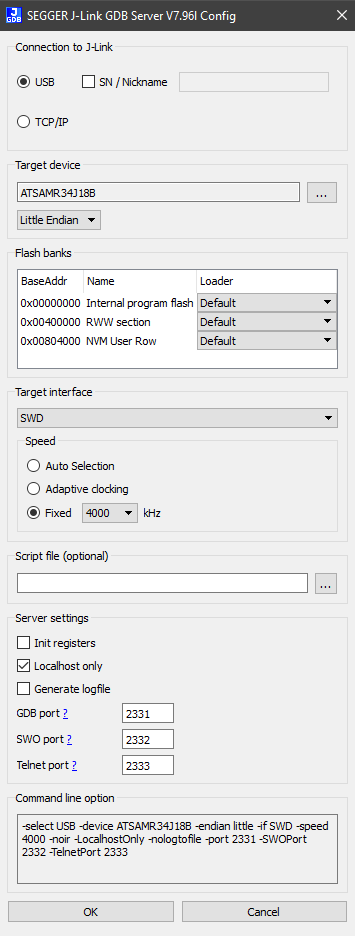
-
This reply was modified 1 year, 7 months ago by
Matt.
-
This reply was modified 1 year, 7 months ago by
Matt.
-
This reply was modified 1 year, 7 months ago by
Matt.
-
This reply was modified 1 year, 7 months ago by
Matt.
-
This reply was modified 1 year, 7 months ago by
Matt.
-
This reply was modified 1 year, 7 months ago by
Matt.
Attachments:
You must be logged in to view attached files.August 22, 2024 at 09:05 #35925support
KeymasterHi,
If VisualGDB adds the “-select IP=127.0.0.1:2331” argument, it means that you have changed the connection mode from “USB” to “TCP/IP”, that doesn’t match the screenshot you provided. If you manually change the “-port” argument to 2331, it will not work because JLinkGDBServer will try to use the same port to connect to GDB and J-Link hardware (that should be using USB instead).
Please do not do this. Changing random settings without understanding them, and mixing screenshots and logs from different setups never works and makes it completely impossible to troubleshoot anything.
If you still cannot get it working, please try creating a new project from scratch, selecting J-Link via debug settings and then:
- Using the “test” button to verify the connection without changing any other settings.
- Running the exact command line from the “test” window without changing anything else.
- Running GDB manually, and connecting to the port specified by “-port“.
If it doesn’t work, please attach:
- The screenshot of the debug settings
- The entire log (including command line) from the test window
- The entire output (including command line) when running JLinkGDBServerCL manually
- The entire output (including command line and all commands) from gdb
If you change anything else, please do explicitly mention it and make sure your screenshots reflect it. Otherwise, it will not work.
August 22, 2024 at 09:10 #35926Matt
ParticipantAh, I see the confusion. When clicking the “test” button, it’s setting up it’s own GDB server. Okay, if I close any existing GDB server programs running and I click “test” then I see a new error.

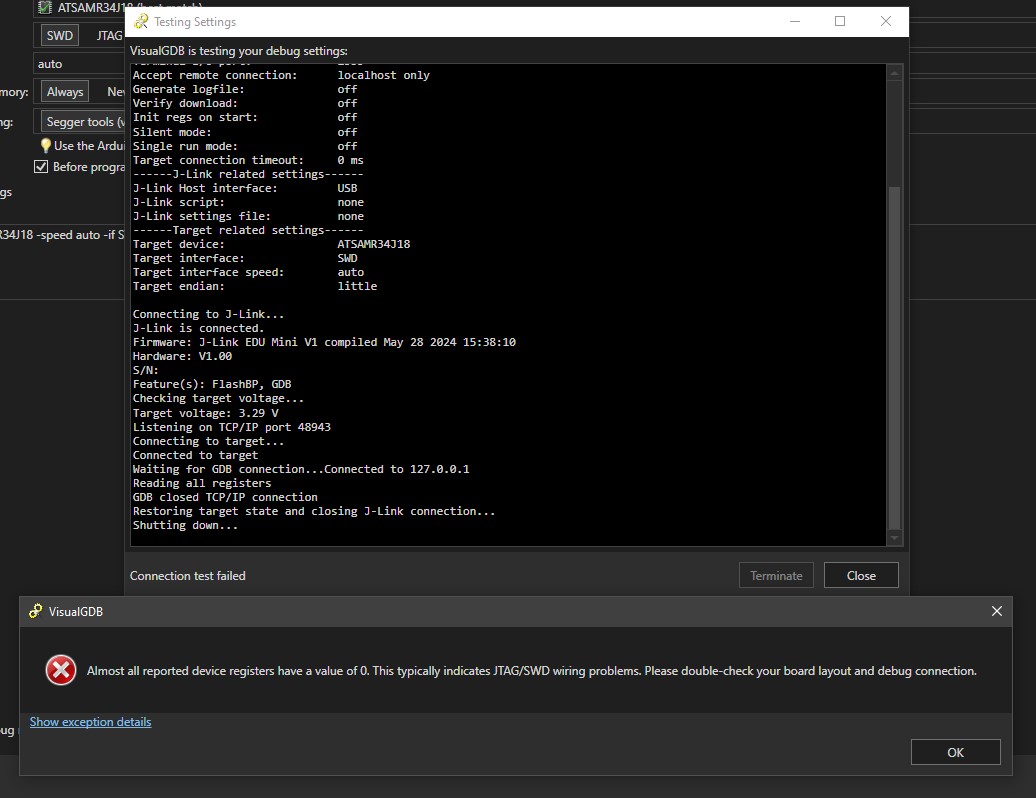
-
This reply was modified 1 year, 7 months ago by
Matt.
-
This reply was modified 1 year, 7 months ago by
Matt.
Attachments:
You must be logged in to view attached files.August 23, 2024 at 06:43 #35933Matt
ParticipantAny suggestions on the current issue I’m facing?
August 23, 2024 at 11:17 #35934support
KeymasterPlease follow the troubleshooting instructions from our previous reply. If you cannot get a working GDB+JLinkGDBServer session outside VisualGDB, the problem is not on the VisualGDB side and it will not work with VisualGDB either.
-
This topic was modified 1 year, 7 months ago by
-
AuthorPosts
- You must be logged in to reply to this topic.