Debugging a Linux kernel without making a project
This tutorial shows how to use the new Kernel Quick Debug feature added to VisualKernel 1.1 to quickly debug a Linux kernel without creating a project or making a module. Before you begin:
- Install Visual Studio
- Install VisualKernel
- Ensure that you have a copy of the kernel image with symbols and sources on the Windows machine
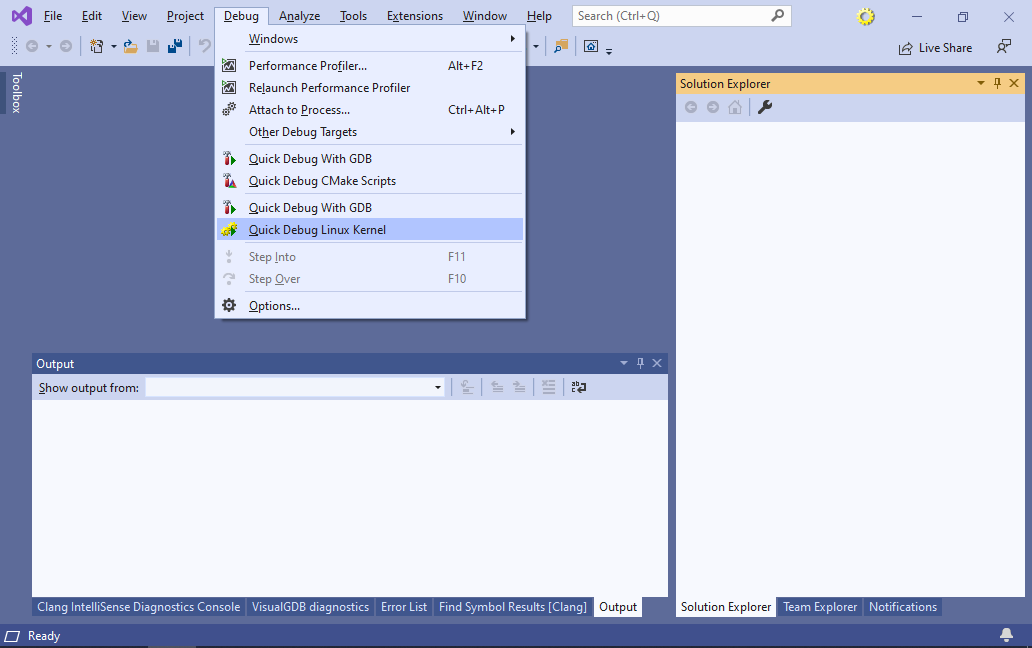
- Start Visual Studio. Select Debug->Quick Debug Linux Kernel:
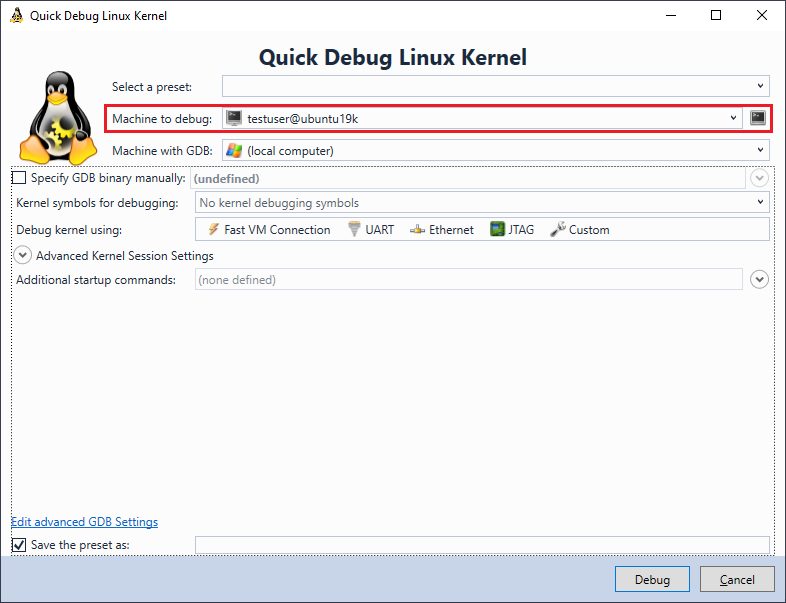
- Select the Linux machine you want to debug:
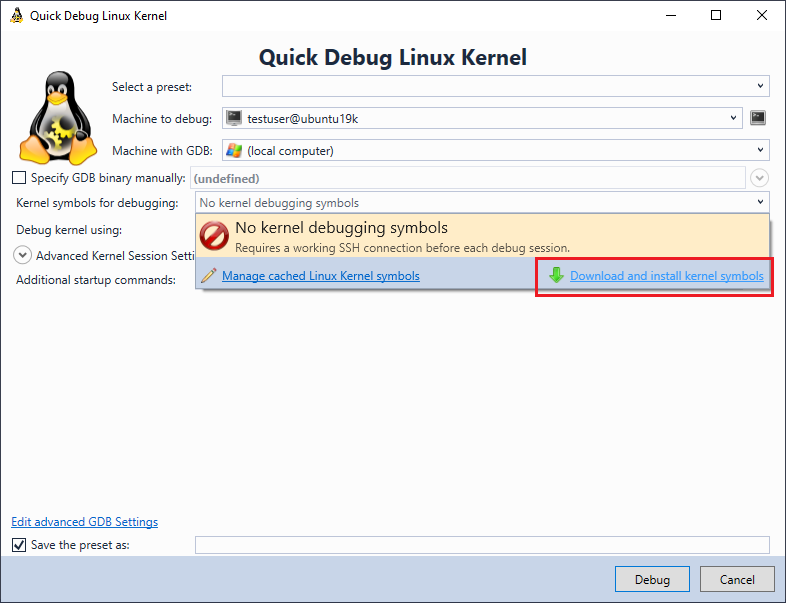
- Then, open the “Kernel Symbols for Debugging” selector and click “Download and install kernel symbols”:
- VisualKernel will need to scan your kernel to determine its parameters and build a list of in-tree modules. This information will be stored in the kernel cache folder. If you are using this for the first time, you will be aked to select a location of the Kernel Cache folder:
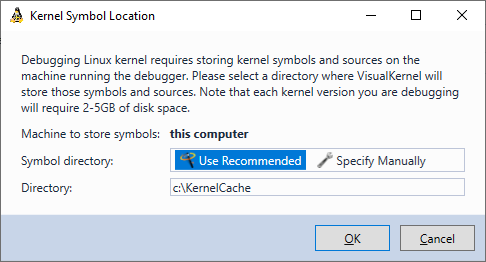
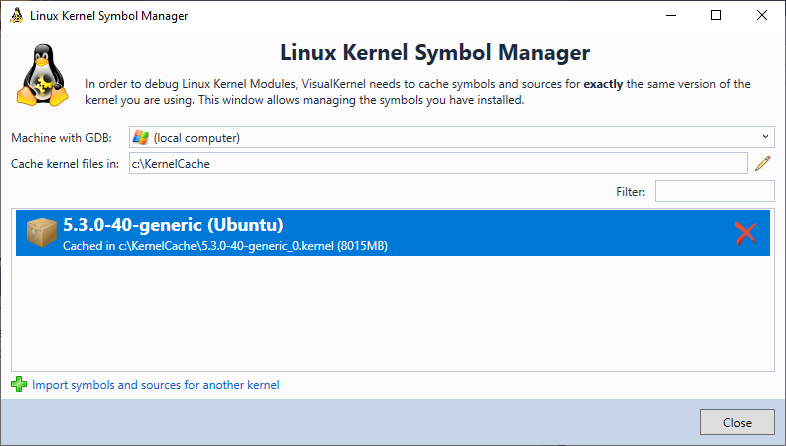
Note that if your kernel files are already stored elsewhere on the Windows machine, you can ignore the warning about 2-5GB of disk space as they will be used from their current location and won’t be copied. - In many cases the symbols can be imported fully automatically. If not, you can always import them manually as shown in this tutorial. You can view and manage the installed symbol packages via Tools->VisualKernel->Manage Linux Kernel Symbols:
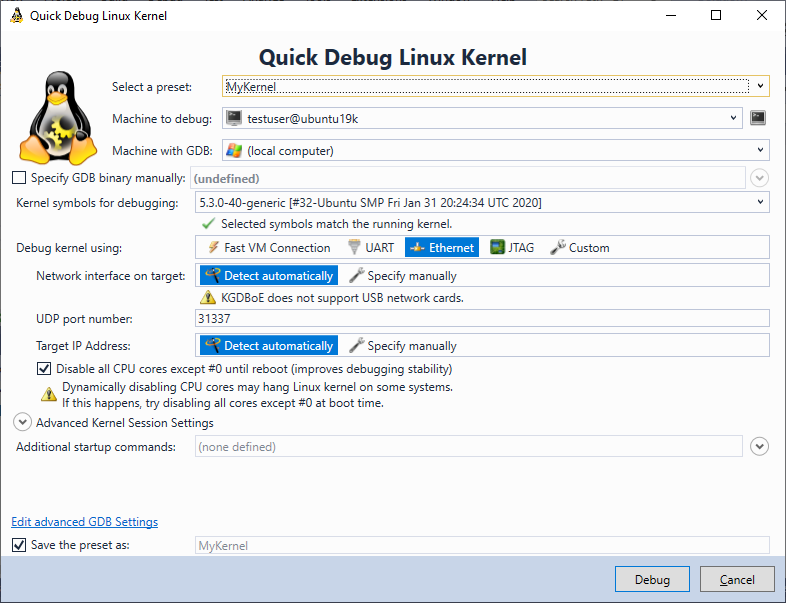
- Select a kernel connection mode (e.g. KGDBoE to debug via network or VMWare stub if you are using a virtual machine):
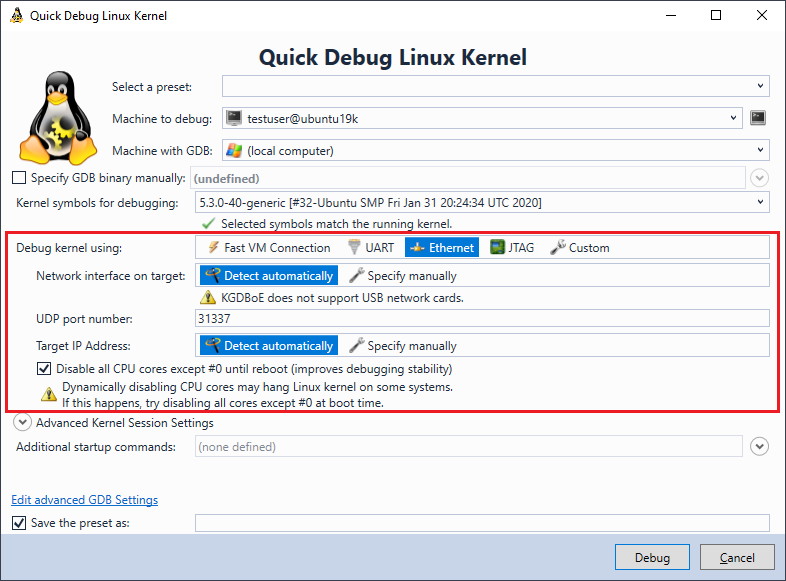
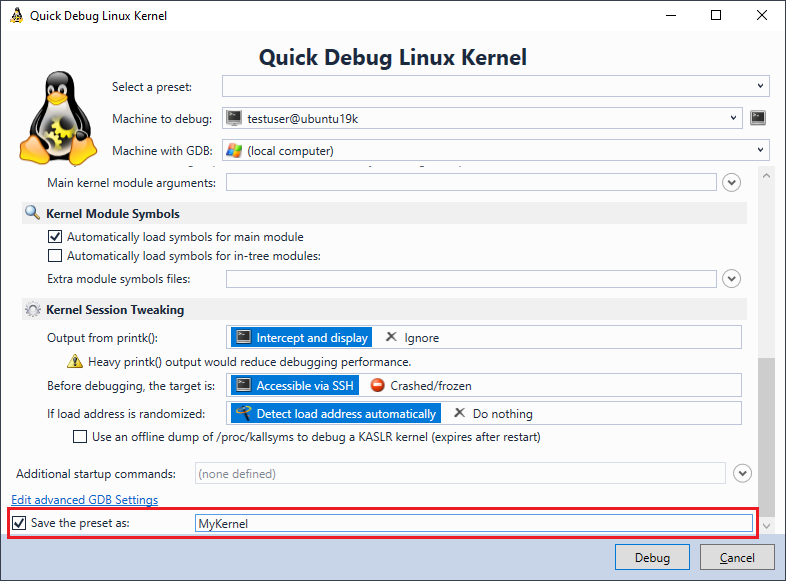
You can get a detailed overview of the debug methods supported by VisualKernel, along with their pros and cons on this page. - If you want to avoid entering all the settings again next time, check the ‘save the preset’ checkbox and enter a name:
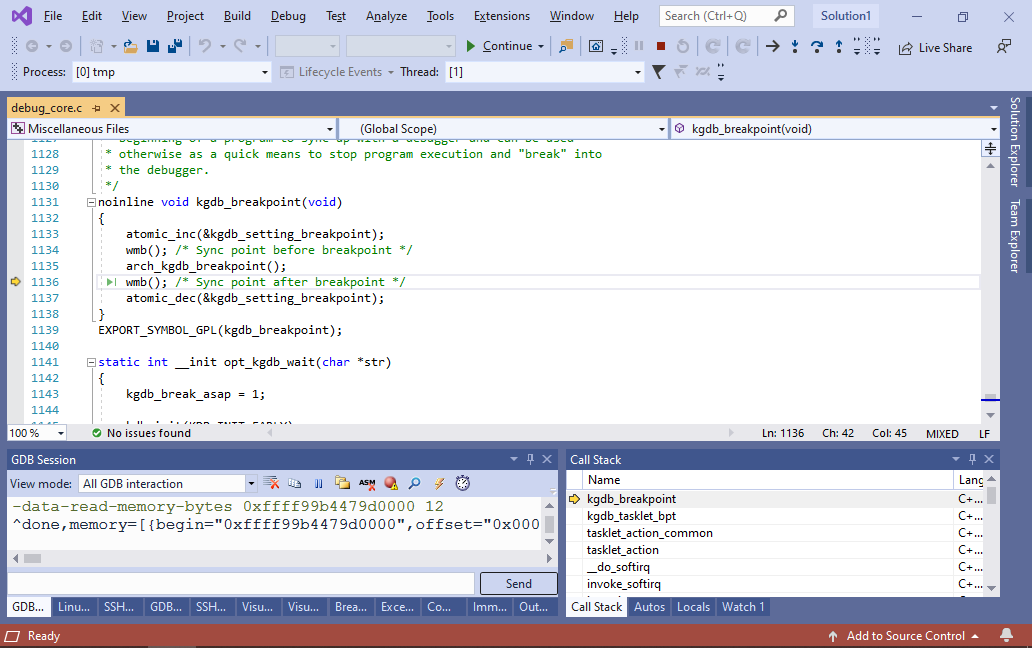
- When you hit “Debug”, VisualKernel will build and install several helper modules that facilitate debugging and eventually stop at the kgdb breakpoint:
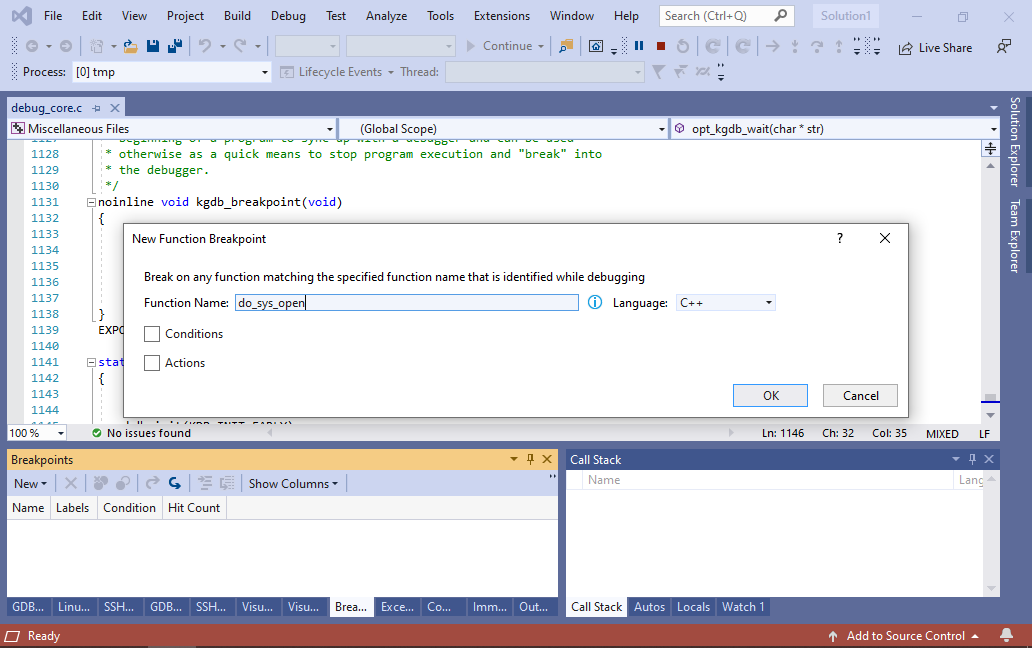
- Now you can use the normal debugging techniques. E.g. you can view the list of loaded module and load the symbols for them or set breakpoints on some kernel functions. Let’s set a breakpoint on do_sys_open():
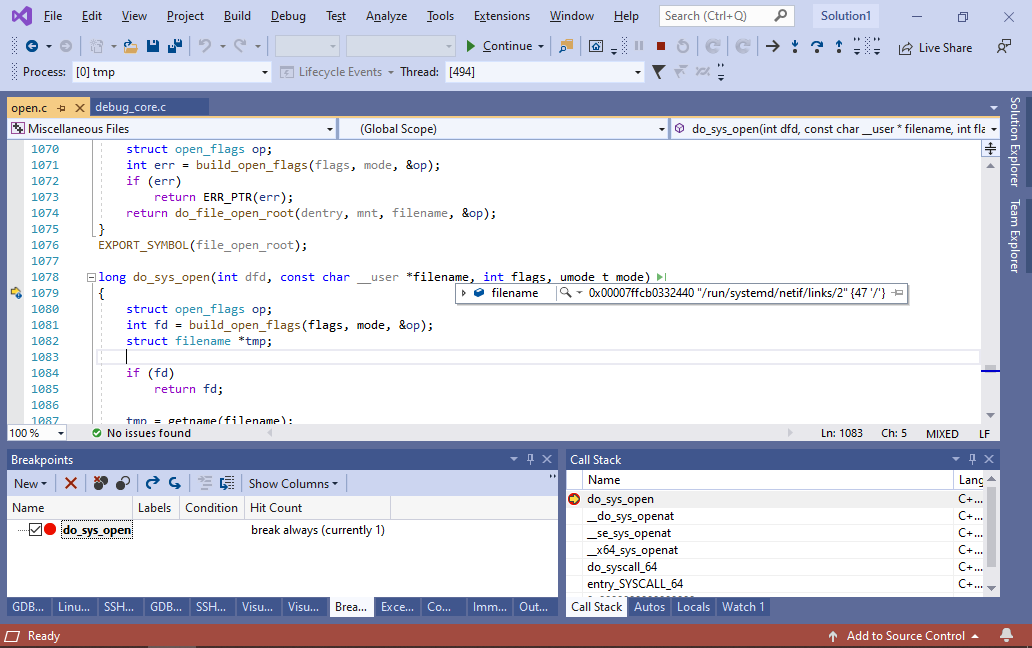
- Press F5 to resume debugging. Eventually some process will try to open a file and the do_sys_open() breakpoint will trigger:
 You can use the normal debugging techniques (stepping, setting breakpoints, evaluating expressions). Just note that normally the kernel is optimized, so some variables will be shown as ‘optimized out’ and stepping will sometimes look awkward, as the optimizer often moves the code around and reuses similar chunks of it. You can also use the GDB session window to send commands to GDB directly:
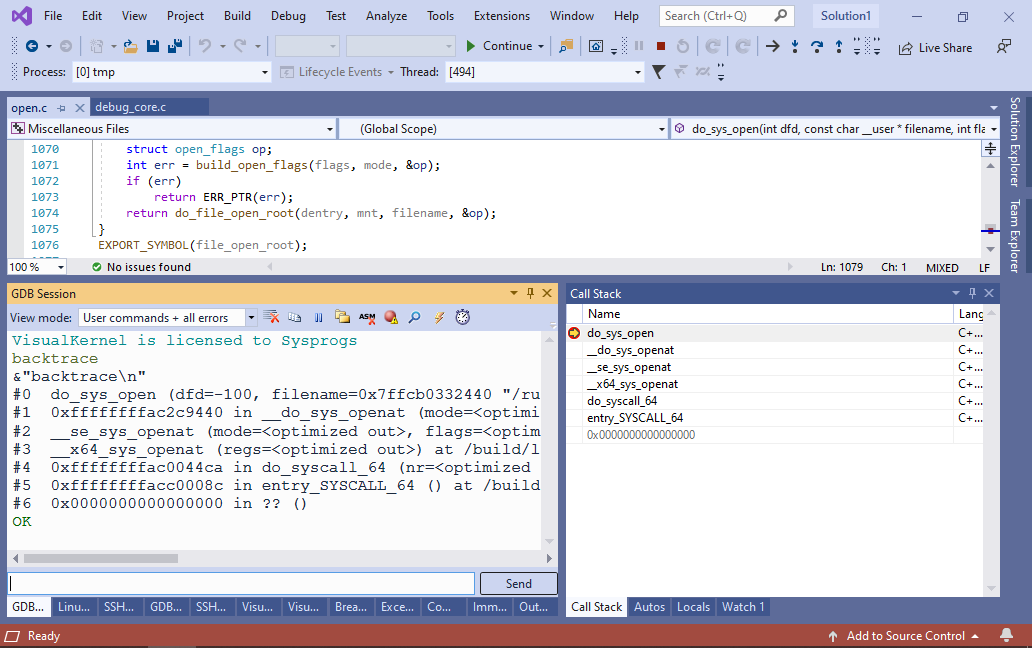
- Press Shift-F5 when you’re done. If you have saved your Quick Debug preset before, you can start debugging again by simply selecting it in the “preset” list in the Quick Debug Linux Kernel window and pressing “Debug”: