Linux Kernel Debugging Overview
Linux Kernel Debugging Overview
This page gives an overview of Linux debugging process used by VisualKernel and explains different methods that can be used to debug your kernel.
Debugging a Linux kernel always involves two machines: one machine running the kernel itself (Target machine) and another machine running the debugger (GDB machine). If the debugged machine is stopped on a kernel breakpoint, it cannot access any files, so the machine with the debugger needs to have a local copy of the kernel image and the relevant source files.
Choosing a debug method
VisualKernel supports 4 primary ways of debugging a Linux kernel:
VMWare GDB Stub
This is the recommended debug method if you are not trying to debug a specific hardware problem. Because the VMWare GDB stub runs outside the guest machine, it is completely isolated from it (hence the crashes or memory corruption in the kernel itself will not affect the operation of the stub). It is also much faster than any other debug method. You can find a detailed tutorial on using the VMWare GDB Stub with VisualKernel here.
KGDB over Ethernet (KGDBoE)
This debug method is the fastest way to debug a physical x86/x64-based computer. It is based on an experimental KGDBoE patch to the kernel that extends the built-in kgdb debugger to support debugging via Ethernet. This method involves running non-trivial parts of the network stack each time it needs to communicate to the GDB machine, so it is generally not very reliable. E.g. if another kernel thread is stopped inside network-related code while KGDBoE needs to communicate with the GDB machine while responding to a breakpoint, it may freeze the entire debugging session. This method does not support all network cards and might not work with all kernel versions, however as it is much faster than KGDBoC (see below), we recommend trying it first when debugging physical x86/x64 machines. You can find a tutorial for KGDBoE here.
KGDB over COM port (KGDBoC)
This method is the most reliable way to debug a physical x86/x64-based machine. Unlike KGDBoE, it does not rely on any complex logic and simply uses a physical COM port to communicate with the GDB machine. However, it is much slower than KGDBoE and requires a physical COM port. You can find a tutorial for KGDBoC here. If you are not debugging a specific hardware issue that cannot be reproduced on a VM, we recommend using a VMWare GDB stub instead.
JTAG
This method is usually the only way to debug ARM-based embedded boards (e.g. Raspberry Pi). It involves a dedicated JTAG debugger (e.g. Olimex ARM-USB-OCD-H) connected to the JTAG pins of the board. As the JTAG interface provides low-level access to the target’s CPU and memory, this method is very reliable and is recommended when debugging ARM-based boards. See our Raspberry Pi tutorial for a detailed example.
Symbols and sources
In order to debug your kernel, VisualKernel needs to store a copy of the kernel image with symbols and the related sources on the machine where it runs GDB. It can be either your Windows machine or a second Linux machine (you cannot store it on the same machine that is being debugged).
The sources and symbols are normally not present on the Linux machine. Instead they are available as separate packages for most of popular distros. VisualKernel can fetch them automatically in most of the cases. Note that sources/symbols for each kernel version occupy 2-5GB of disk space. Use the Tools->Manage Linux Kernel Symbols command in Visual Studio to manage the symbol packages that have been cached on your machine: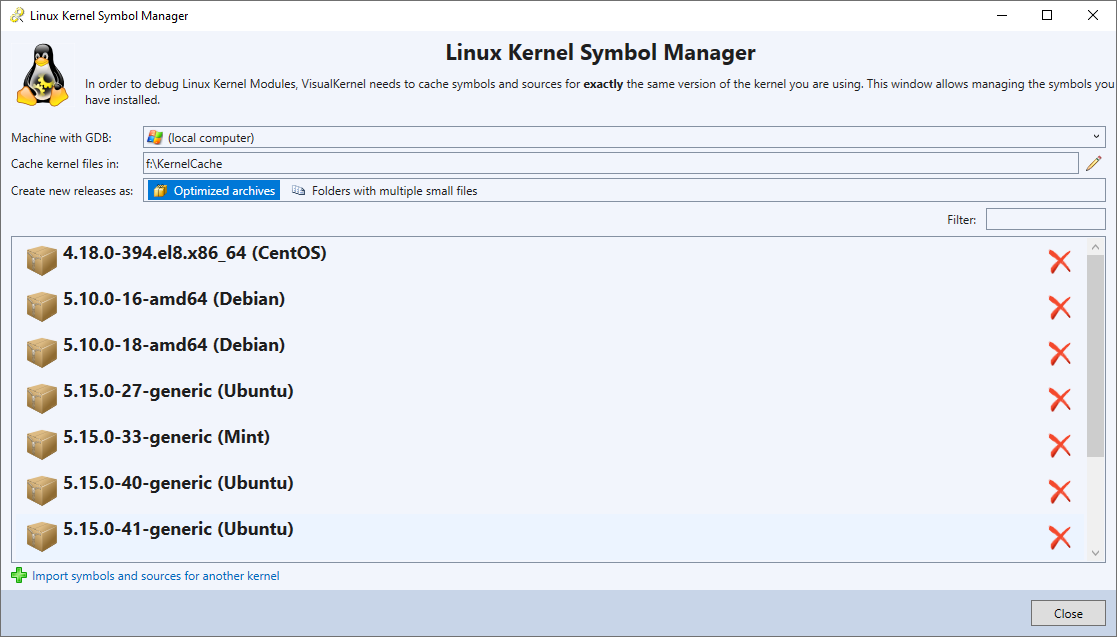
If you are using a 2-machine setup (build your code on one Linux machine and deploy it on another one), the files will be stored on the build machine and not on the Windows machine.
Each kernel symbol directory has the following contents:
- The kernel image with symbols (typically called vmlinux). It should 100% match the kernel image on the debugged machine (i.e. the image on the debugged machine should be a stripped version of the vmlinux file inside the symbol directory).
- A source folder containing kernel source files.
- A folder containing symbols for in-tree modules.
- A description file (KernelRelease.xml). It contains the version of the kernel, lists in-tree modules and other properties.
Building and deploying
When you use one-machine configuration, VisualKernel will do the following each time you build your module:
- Transfer the updated source files to the Linux machine
- Build the kernel module on the Linux machine
- Transfer the module with symbols from the Linux machine back to the Windows machine
When you start debugging your module, VisualKernel will do the following:
- Find a kernel symbol package on your Windows machine that matches the remembered kernel version
- Start a GDB session using symbols and sources from that package
- Connect to the debugged machine using SSH
- Launch your kernel module
- Load the symbols transferred to the Windows machine during build
The module symbol file is stored in the VisualGDBCache subdirectory inside your project directory.