Using Live Watch to Monitor Kernel-Mode Code in Real Time
This tutorial shows how to use Live Watch to monitor the state of your kernel-mode code without having to stop it in the debugger.
Before you begin, install Visual Studio and VisualKernel 4.0 or later.
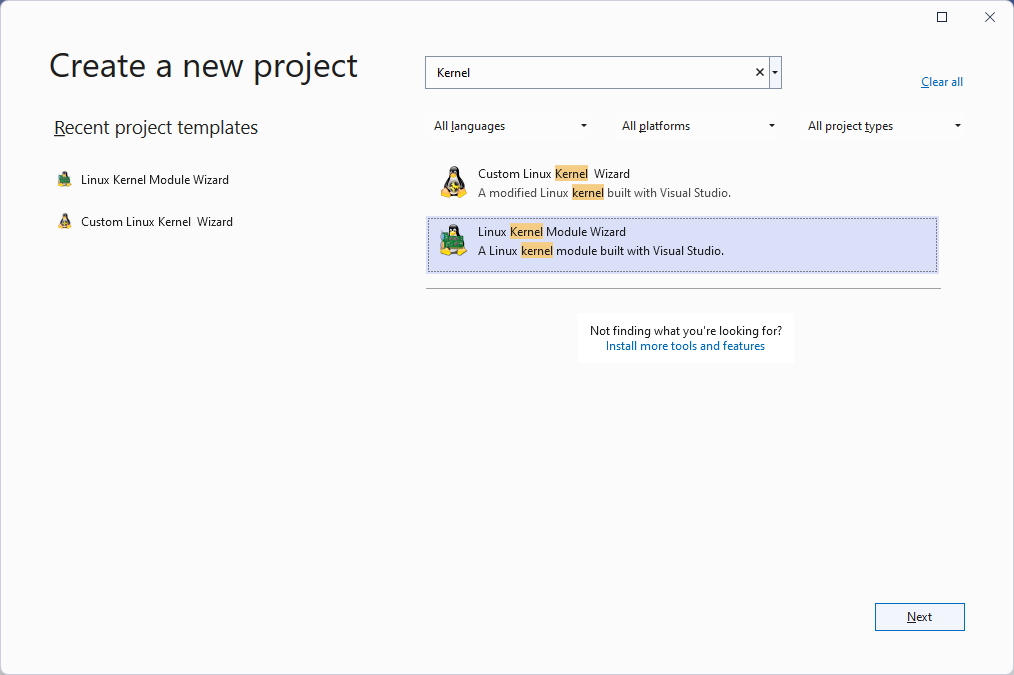
- Start Visual Studio and open the Linux Kernel Module Wizard:
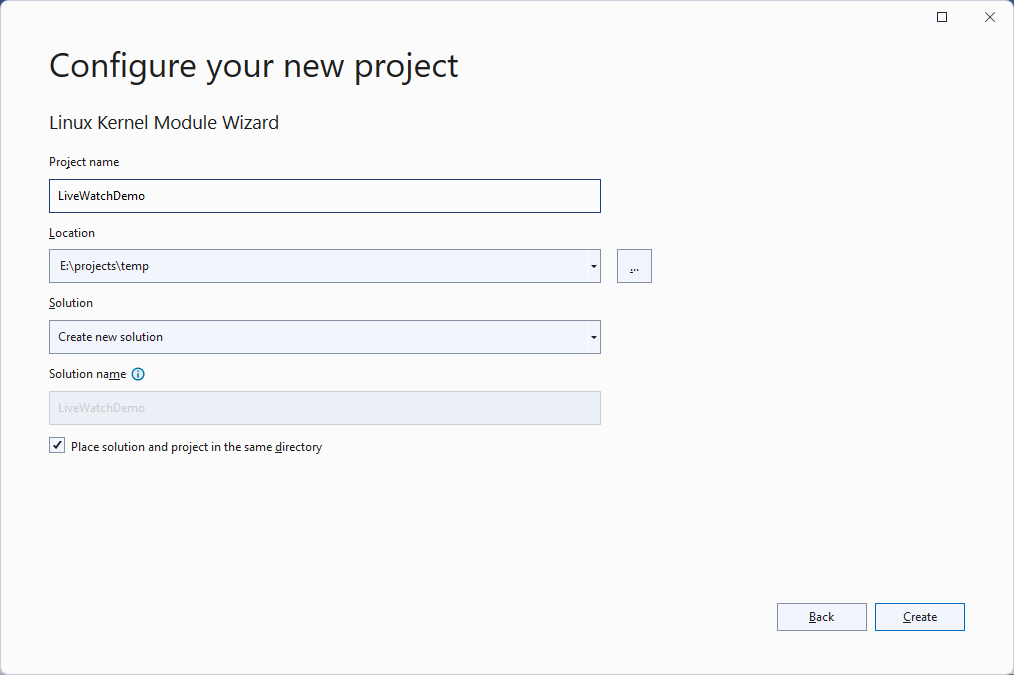
- Enter the name and location for your project:
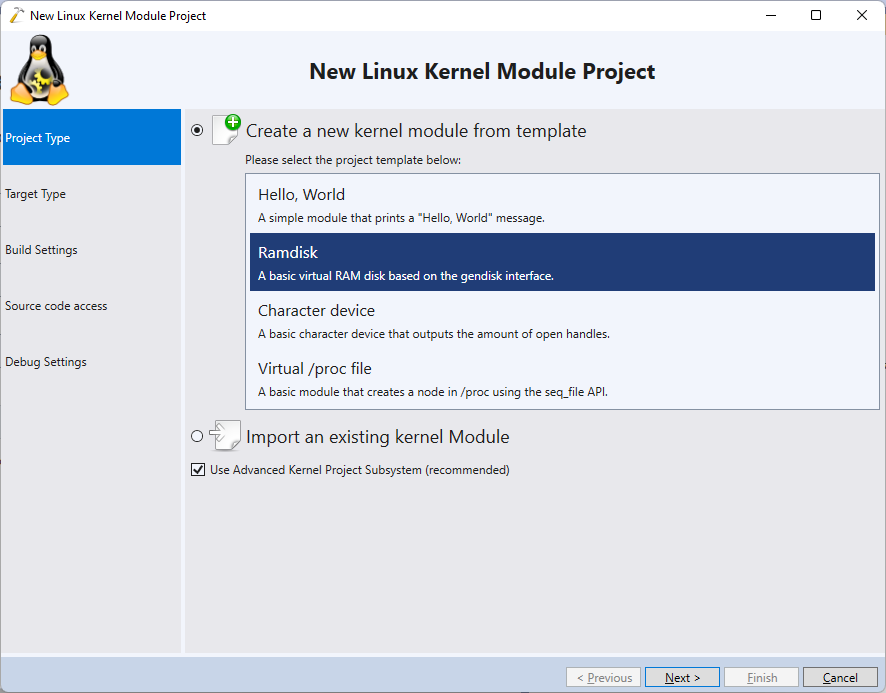
- Select the project template you would like to use. In this tutorial we will create a basic RAM disk and will show how to monitor its read/write count without setting any breakpoints, hence select “Ramdisk” and click “Next”:
- Select the target you would like to use. Live Watch transfers data via the network interface, so it supports most of the kernel targets:

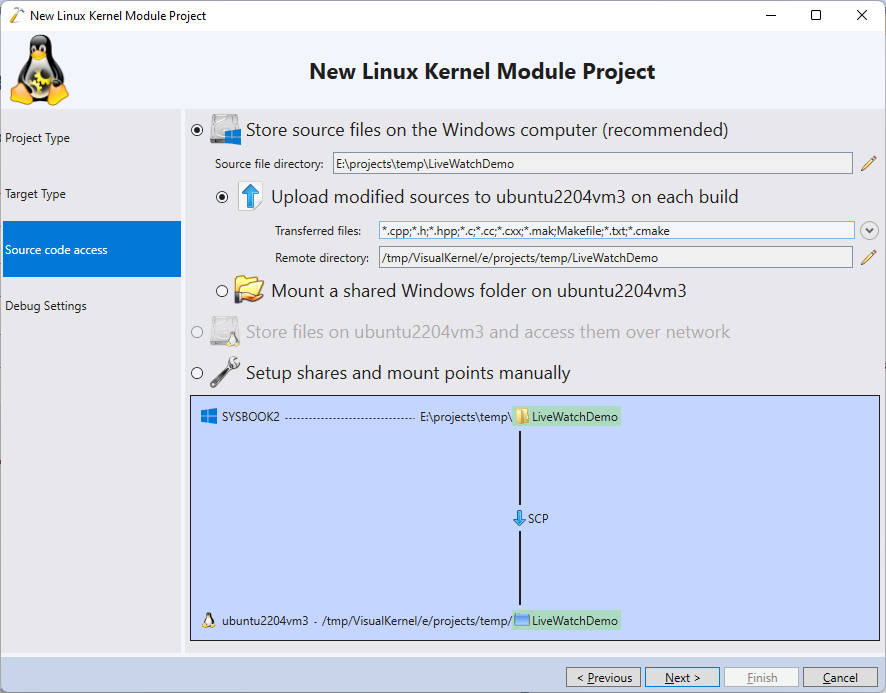
- Proceed with the default selection of storing the sources on the Windows side:
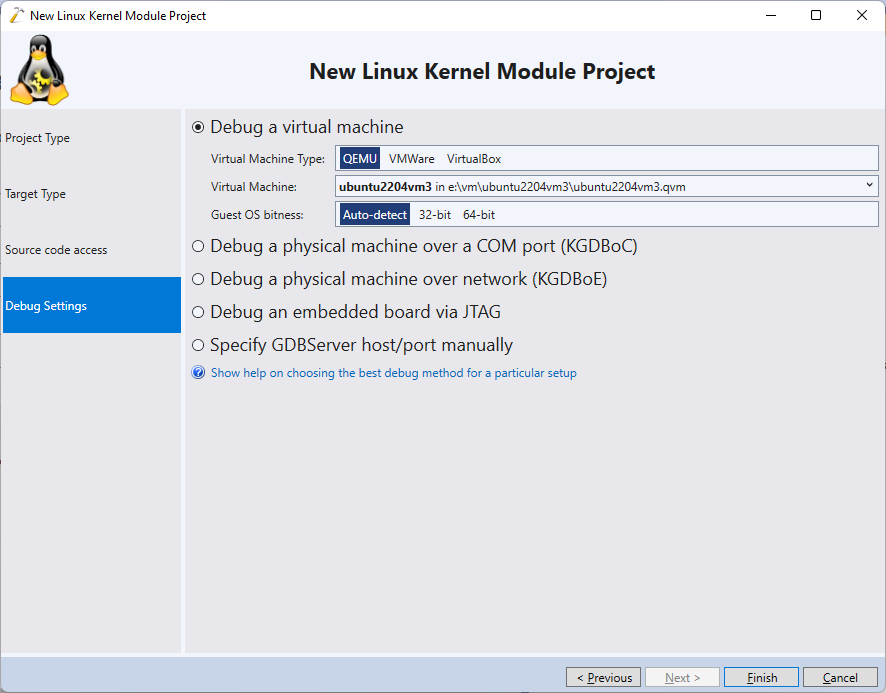
- Finally, select the debug settings that work for your target and click “Finish” to create the project:
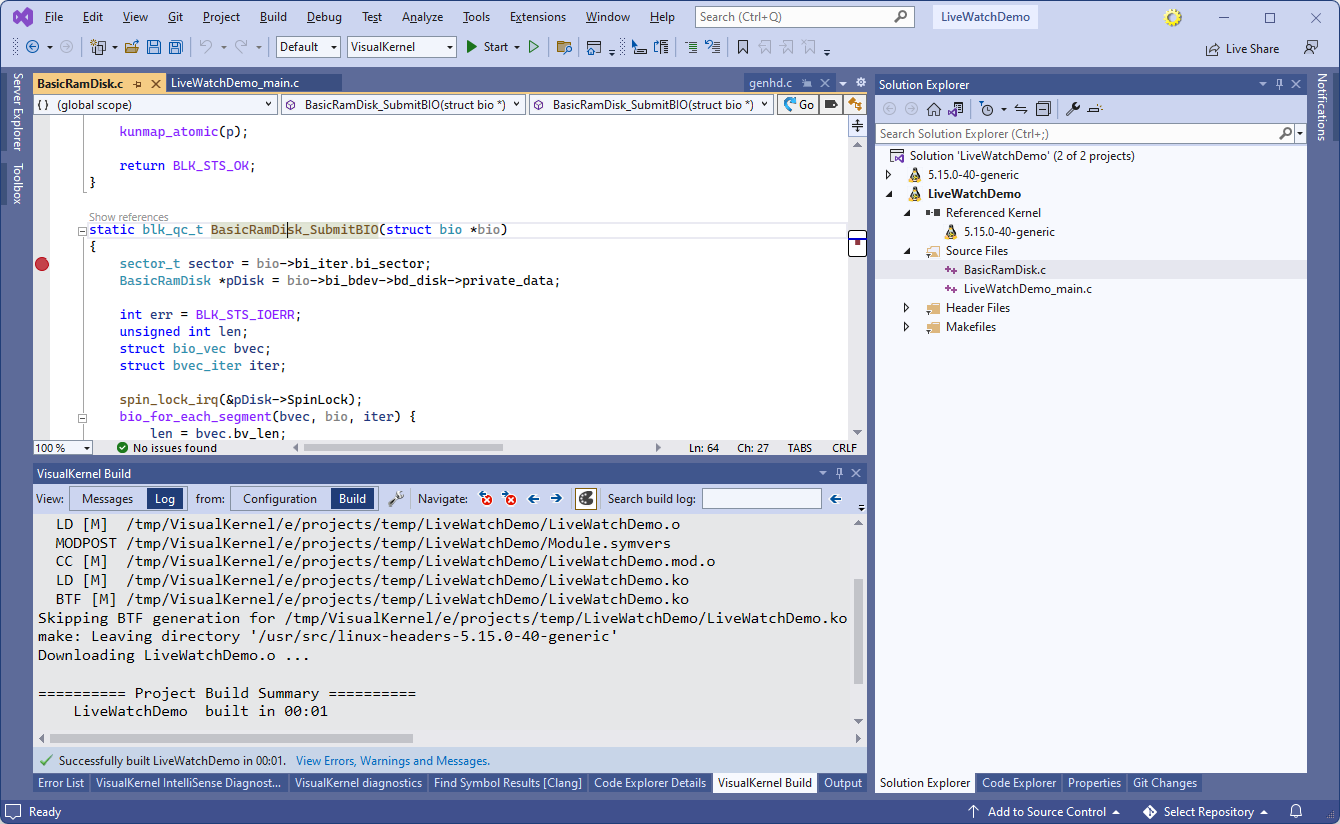
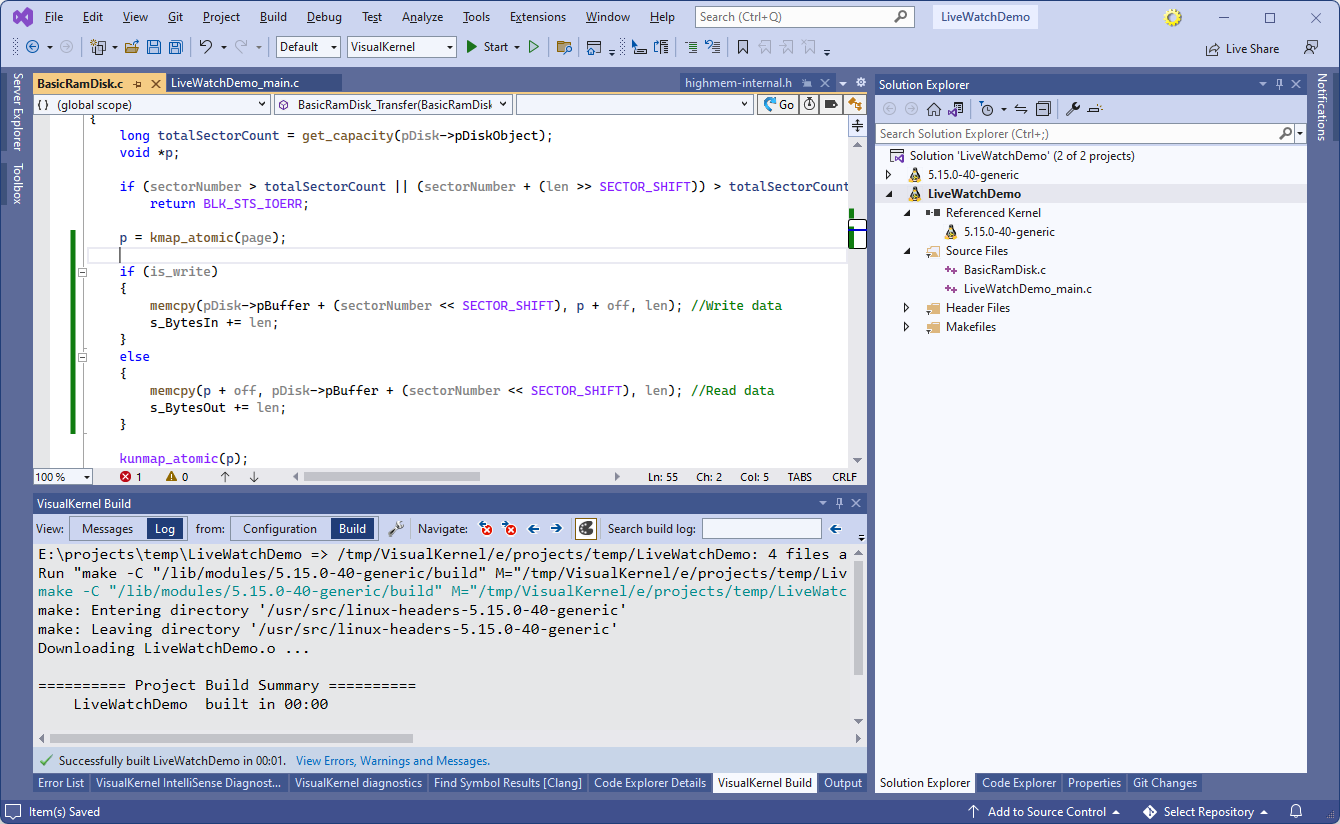
- Once the project has been created, you can build it by pressing Ctrl-Shift-B:
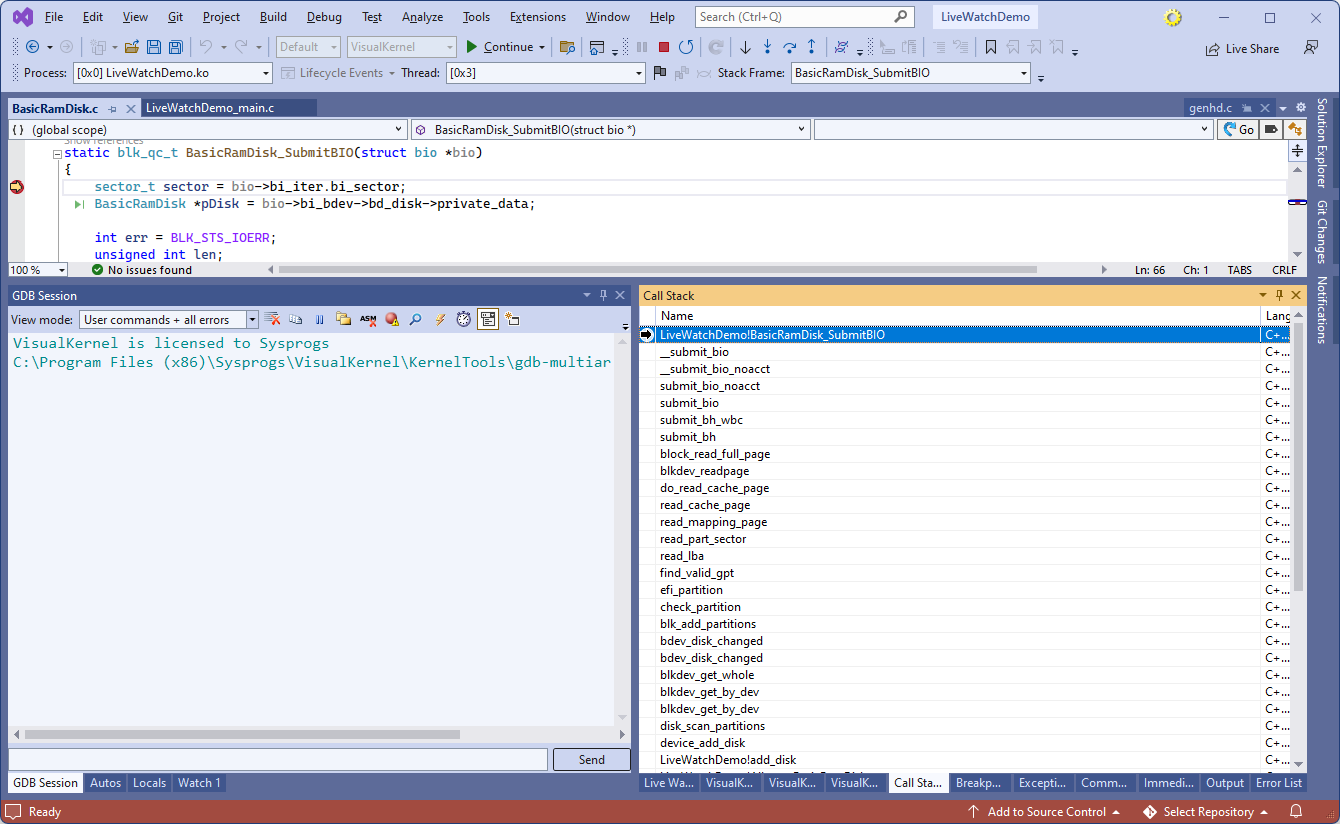
- Once the build succeeds, try setting a breakpoint in the BasicRamDisk_SubmitBIO() function and press F5 to begin debugging. Once the triggers, use the Call Stack window to see the context of the call. In this example, the first I/O operation submitted to the disk comes from the disk_scan_partitions() function trying to scan the partition table:
- Press F5 to continue debugging. Then, right-click on the project node in Solution Explorer and select “Open a new SSH window”:
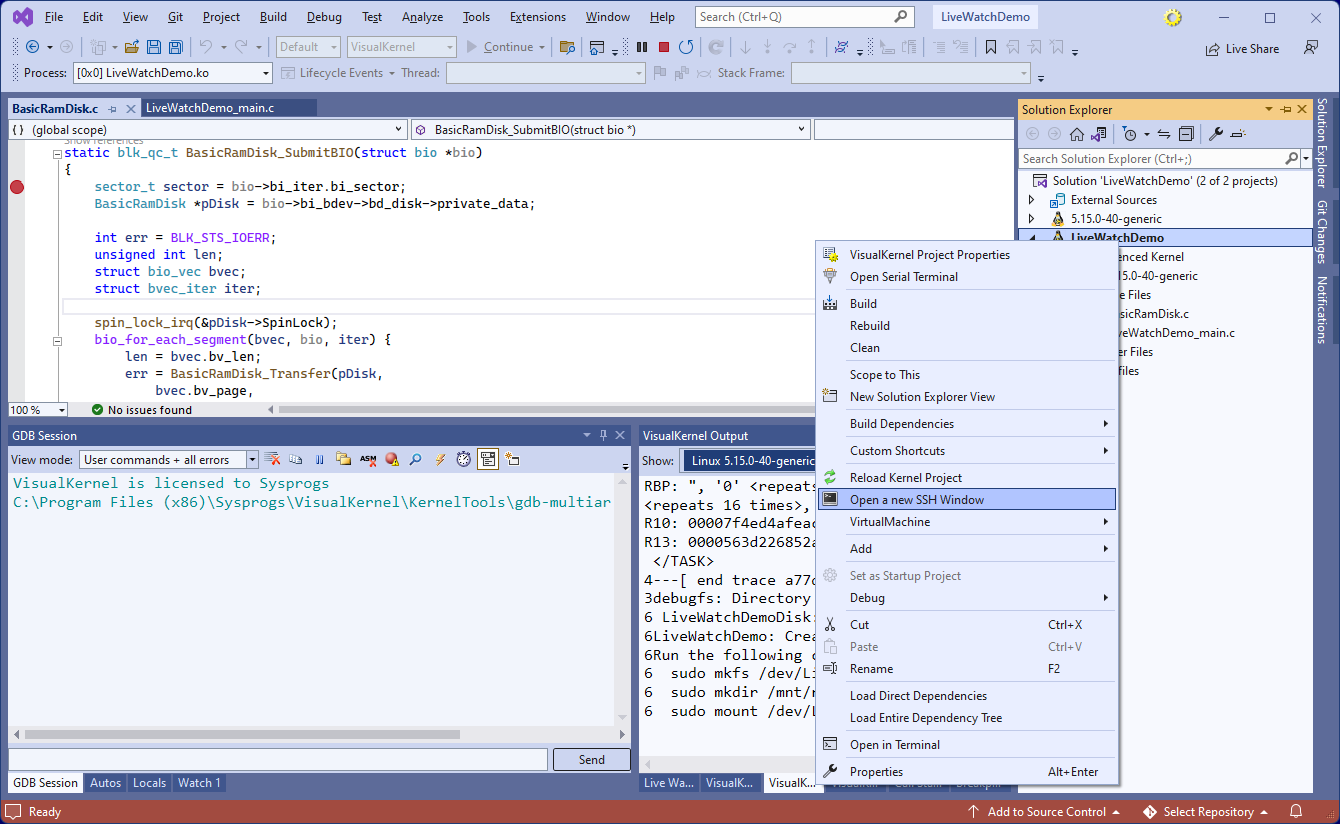
- Once the window opens, run “sudo dmesg” to view the commands necessary to test out the RAM disk:
sudo mkfs /dev/LiveWatchDemoDisk1
sudo mkdir /mnt/ramdisk
sudo mount /dev/LiveWatchDemoDisk1 /mnt/ramdisk
Run the commands from the dmesg output and make sure the disk is initialized and mounted:

- Using the debugger to see what is going on could be useful in many scenarios, however it stops the target while you are examining its state. Live Watch avoids this by sampling the values of different variables over the UDP connection without having to stop the target. In order to test it out, add the following 2 variables to the BasicRamDisk.c file:
static uint64_t s_BytesIn;
static uint64_t s_BytesOut;
Then, update the BasicRamDisk_Transfer() function to increment either s_BytesIn or s_BytesOut depending on the direction of the transfer:
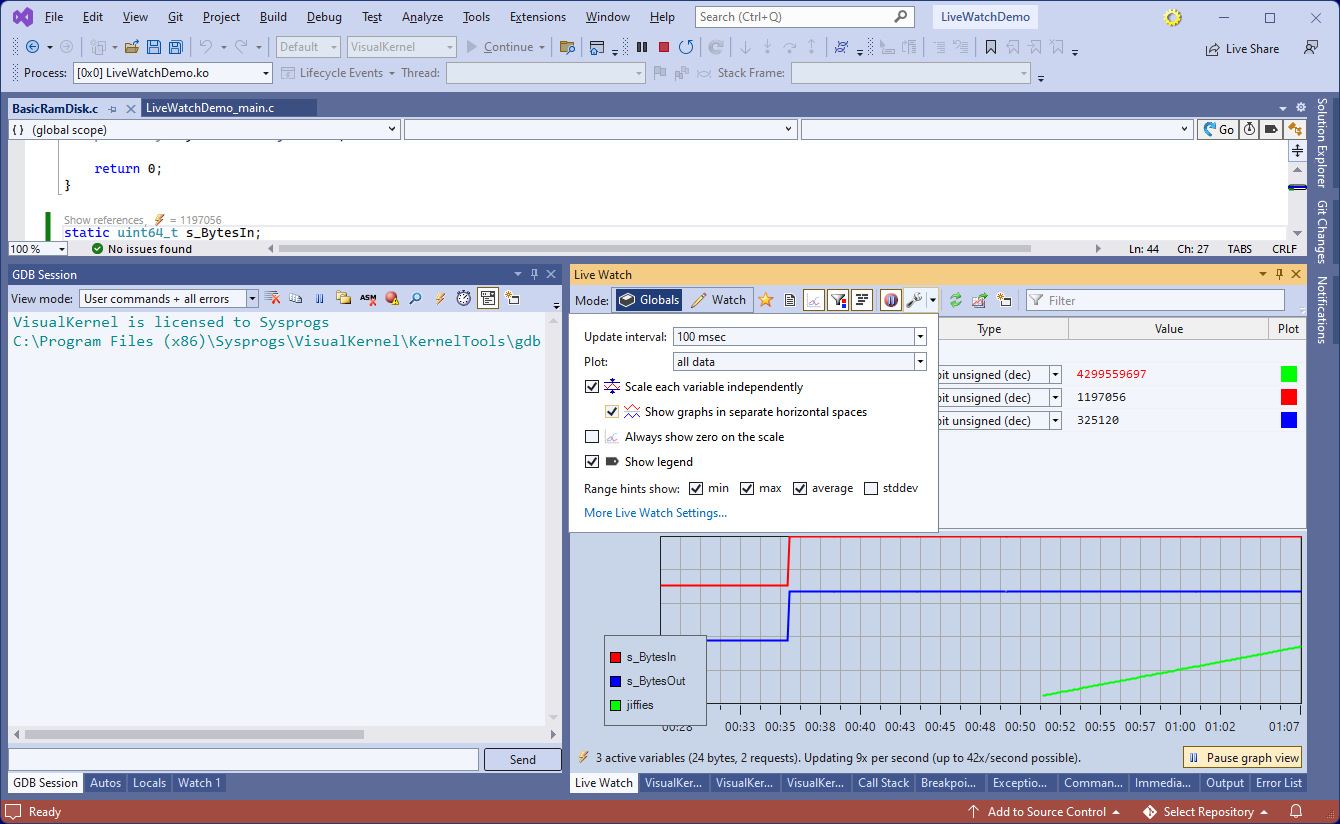
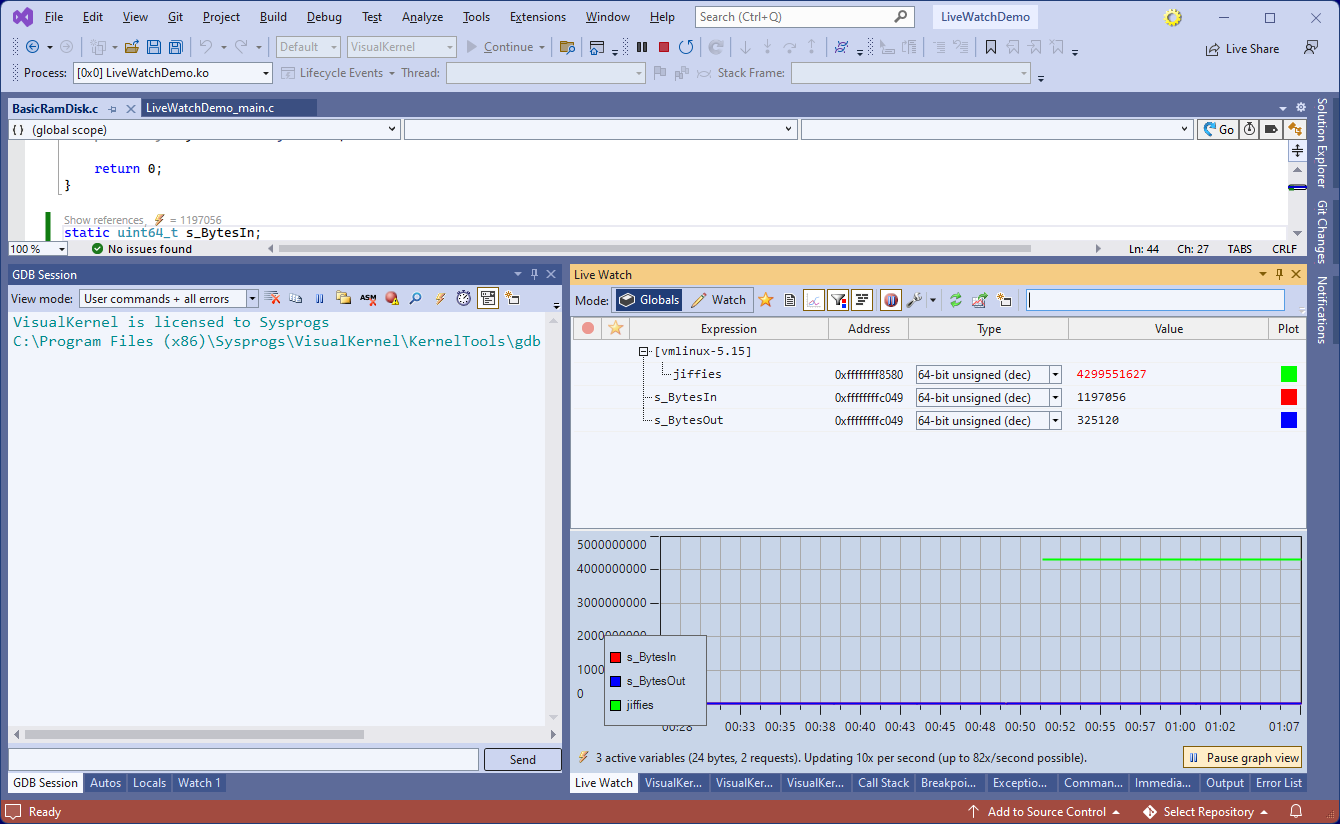
- Start the debug session, open the Debug->Windows->Live Watch window and switch it to the Globals view. Observe how the values of s_BytesIn and s_BytesOut are immediately shown both in the Live Watch window and directly in the code:
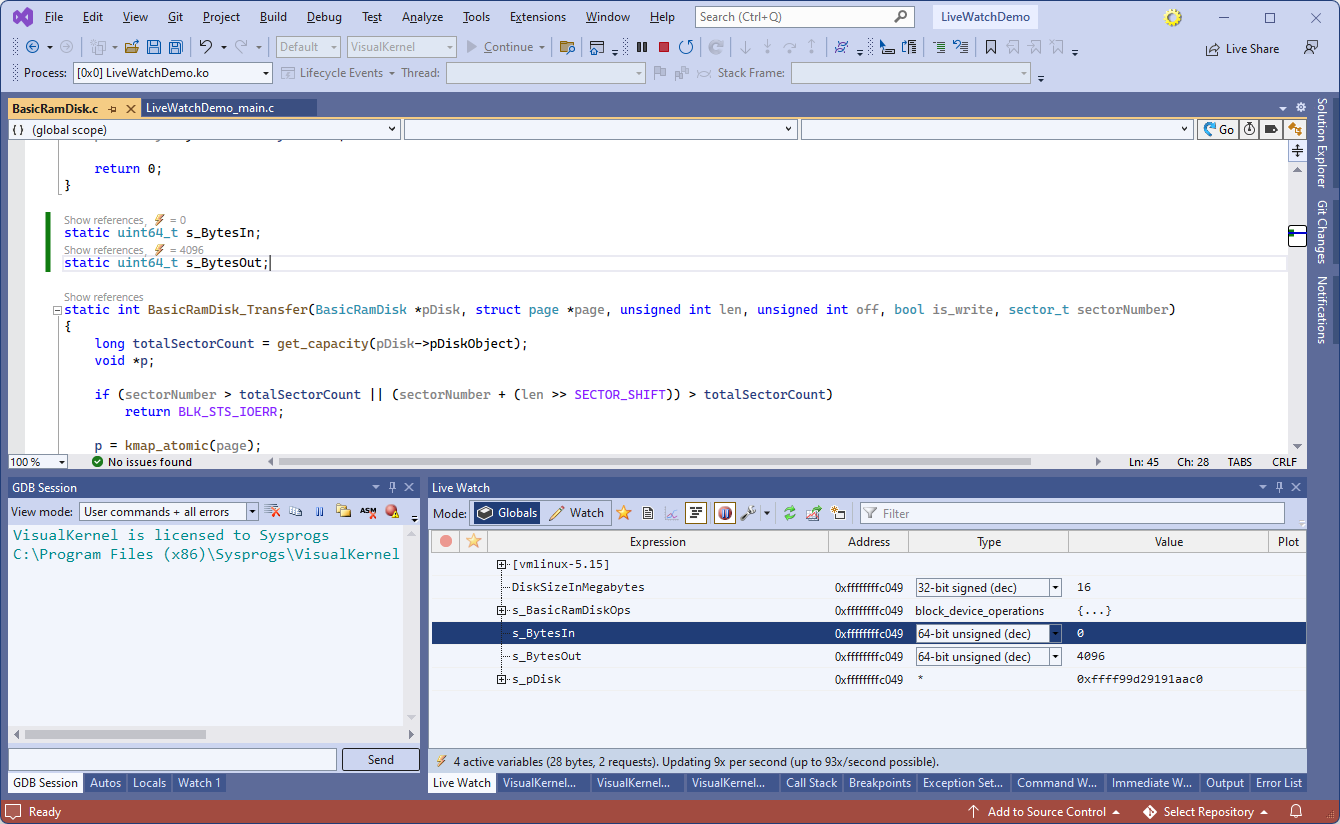 You can read more about various Live Watch modes and settings on this page.
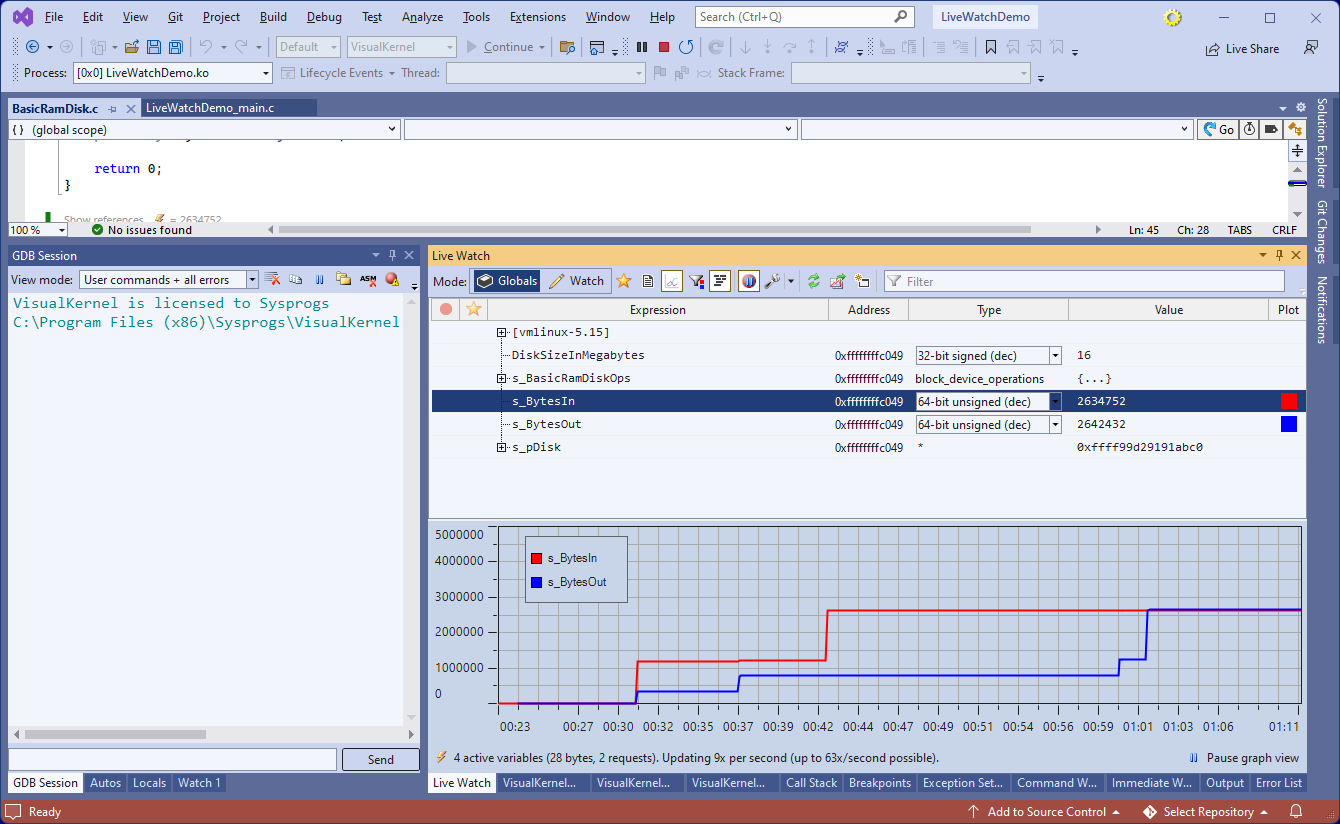
 - Click the “Plot” column for both variables, then try copying some data to the RAM disk. Note how the data is actually written when you run the “sync” command (00:42 below). Try unmounting the disk, remounting it and comparing the copied file. Observe how the number of read bytes now matches the number of written ones:
- You can also use Live Watch to observe and plot various variables from the kernel itself. Expand the [vmlinux] node in Live Watch and type “^jiffies” in the filter:
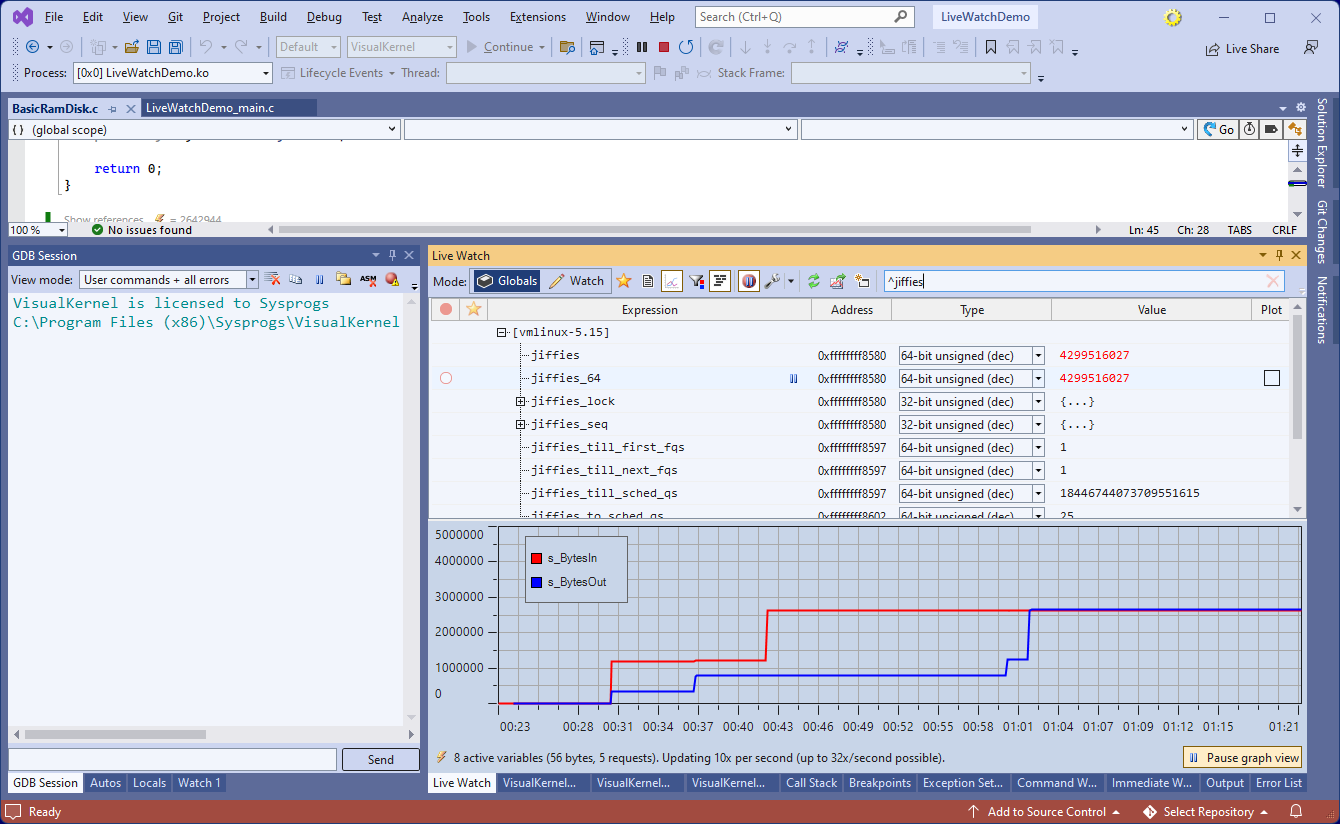
- Click the plot column to plot the value of jiffies (system clock):
 Note that because the value of jiffies is much larger than the values of s_BytesIn or s_BytesOut, it completely eclipsed both of them on the graph.
 - Click the settings button and enable the “scale each variable independently” checkbox. See how the values are now properly visible:

- You can configure VisualKernel to show the graphs in separate horizontal spaces (i.e. under each other), so that similar changes to multiple graphs won’t obscure each other: