Creating Embedded Projects on Windows
This tutorial shows how to create a basic STM32 project using CodeVROOM on Windows. For other platforms, see the Linux and MacOS tutorials.
- Download the latest CodeVROOM executable and run it:
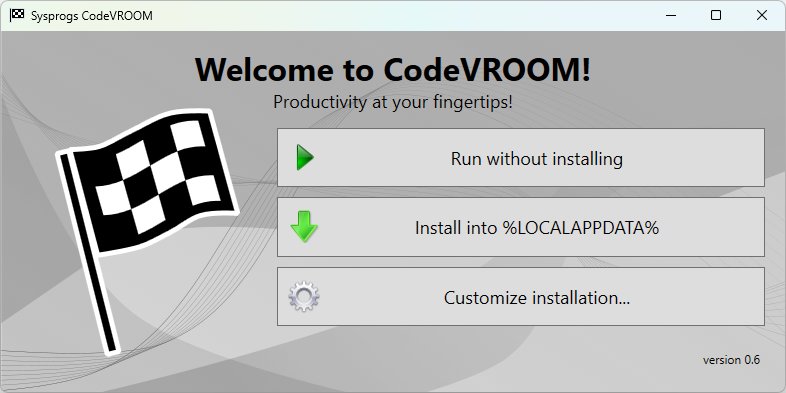
- You can run it in place or install to either %LOCALAPPDATA% or Program Files. Installation only takes a few seconds and can be easily undone via the Add/Remove Programs window. Once CodeVROOM is started or installed, its main window will look like this:
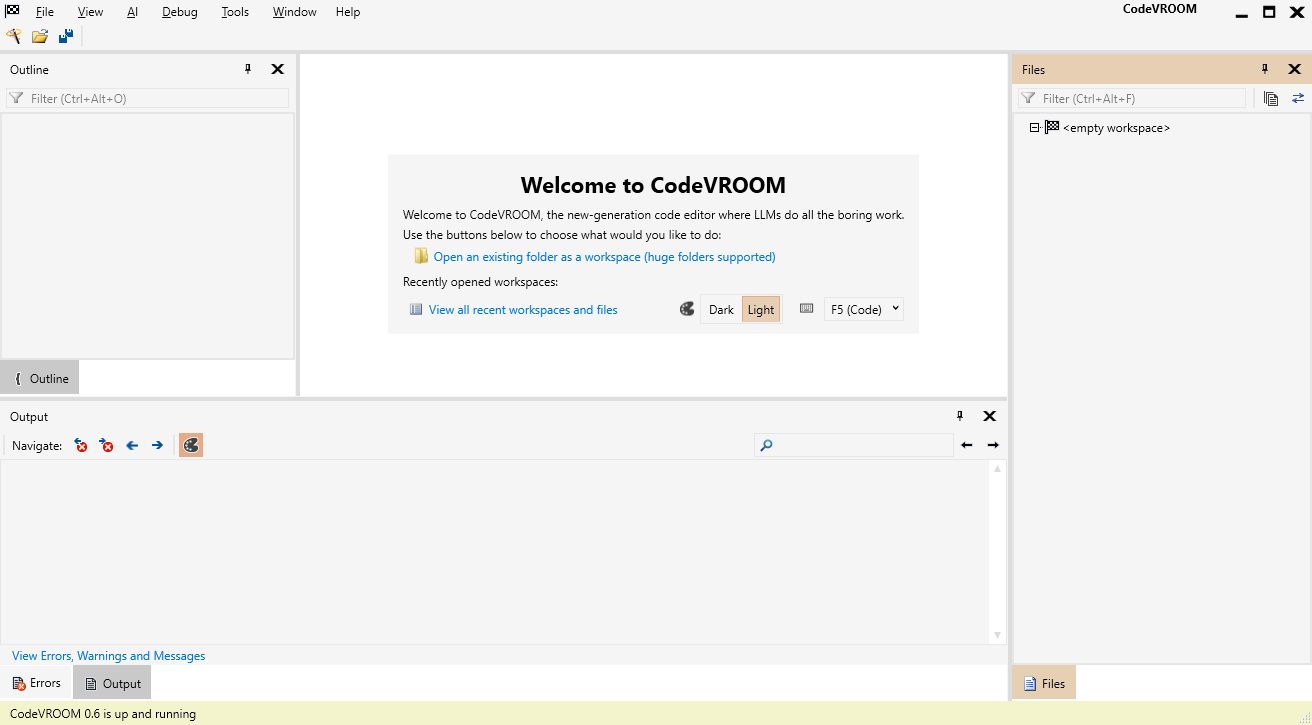
- Use the File->New->Project command or the toolbar button to create a new project:
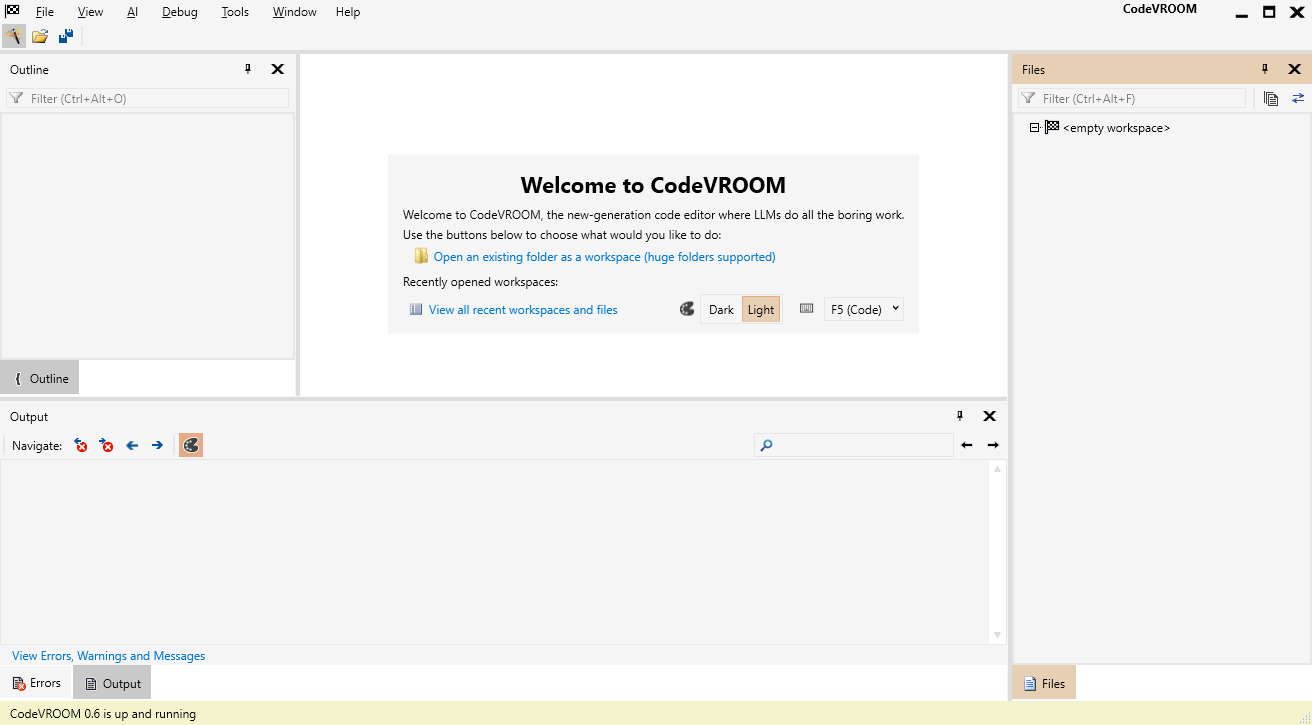
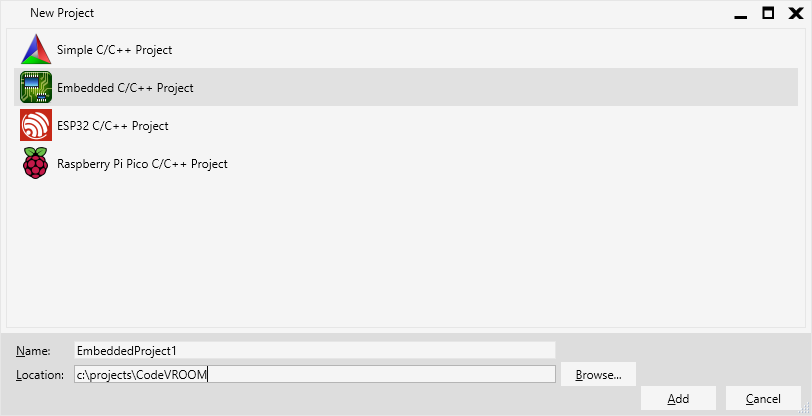
- Select the Embedded project wizard:
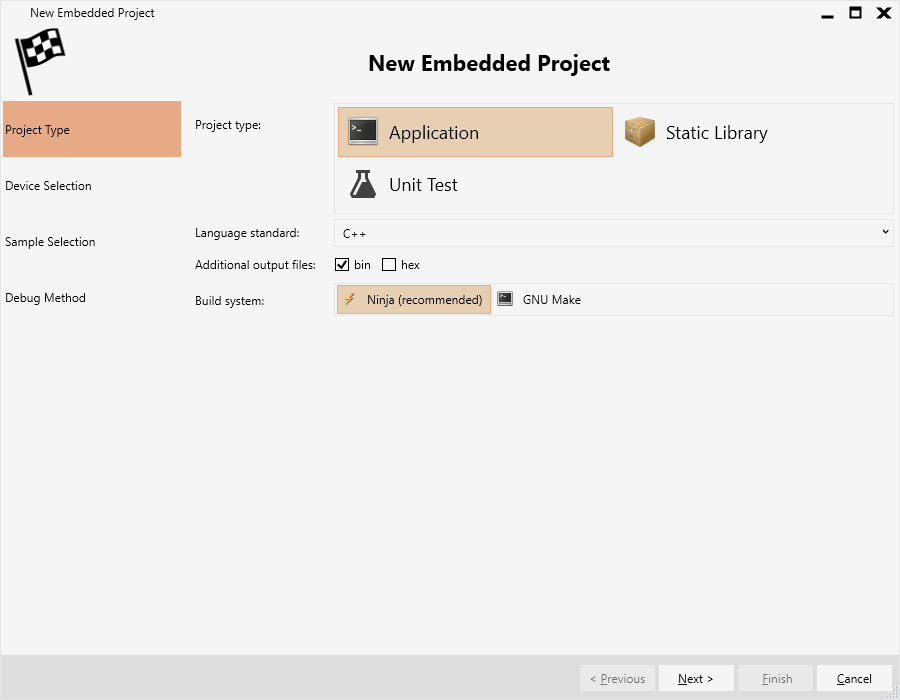
- The Embedded Project Wizard is a simplified version of the VisualGDB’s project wizard and offers similar choices. Proceed with creating a default application:
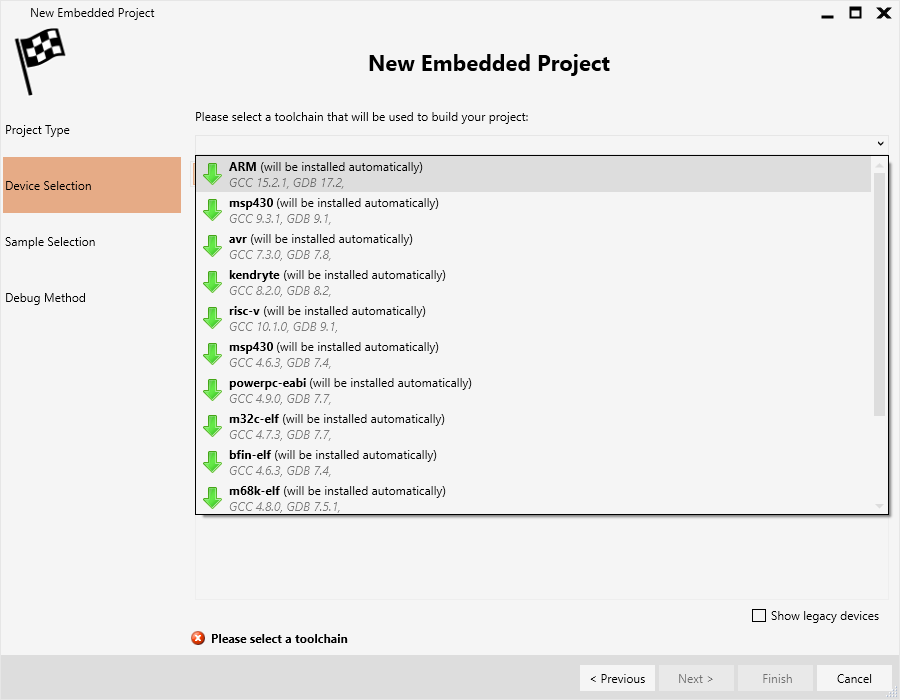
- If you have tried VisualGDB on that machine, CodeVROOM will automatically pick up the toolchains and BSPs from it. If not, locate the ARM toolchain installer in the list and select it:
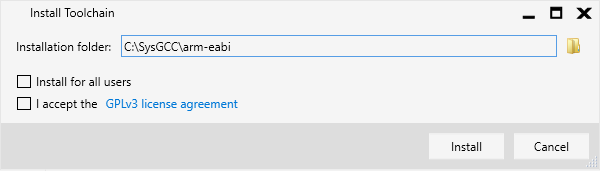
- Select the installation folder and press “Install”:
- Once the toolchain is installed, VisualGDB will display the devices compatible with that toolchain. Select the STM32F407VG (used in STM32F4-Discovery) and click “Install”:
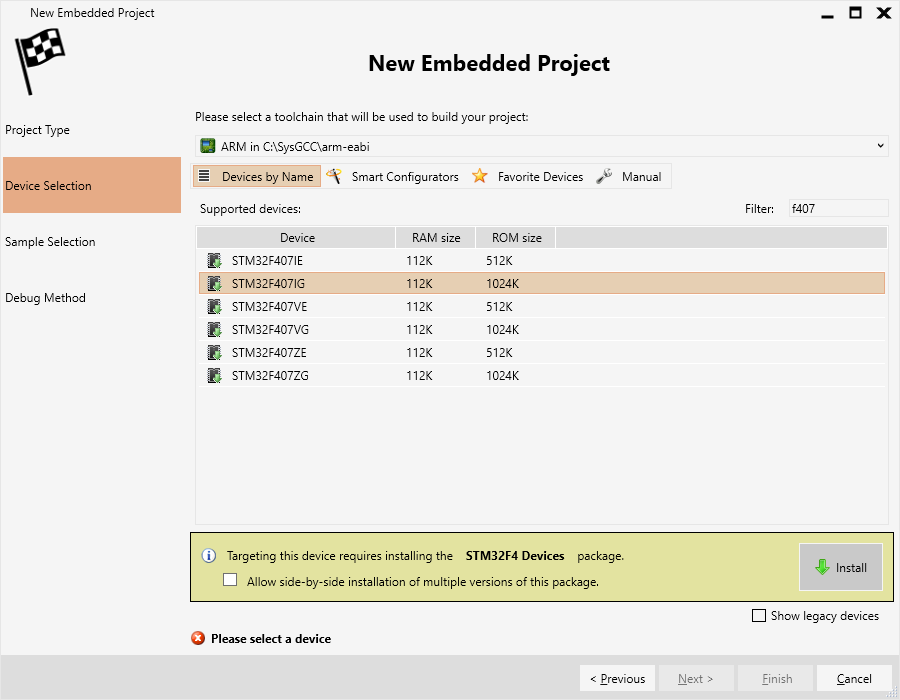
- Once the device support is installed, CodeVROOM will show the device configuration options equivalent to the ones from VisualGDB. Proceed with the default settings:
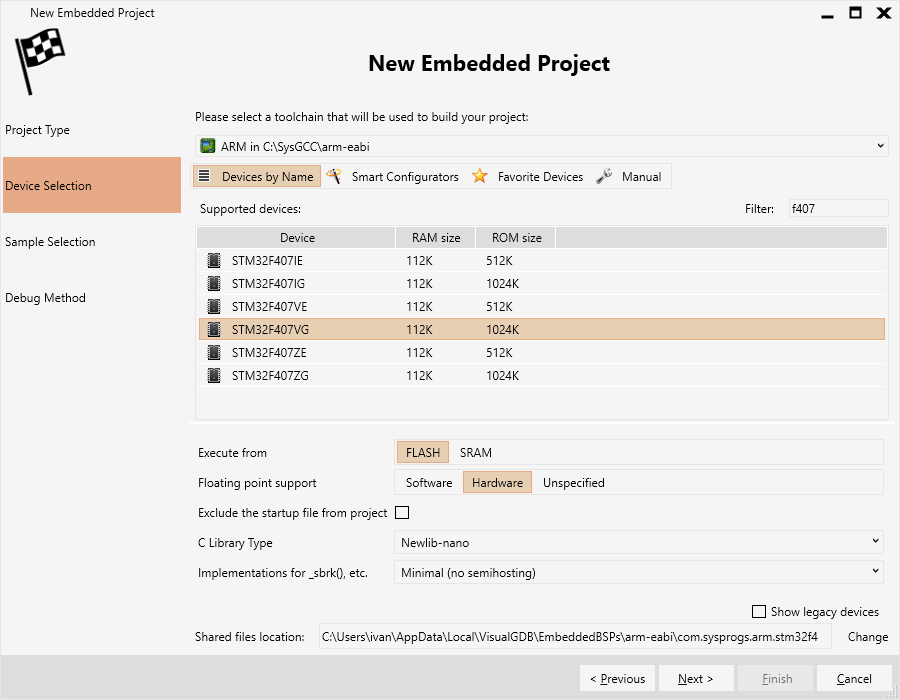
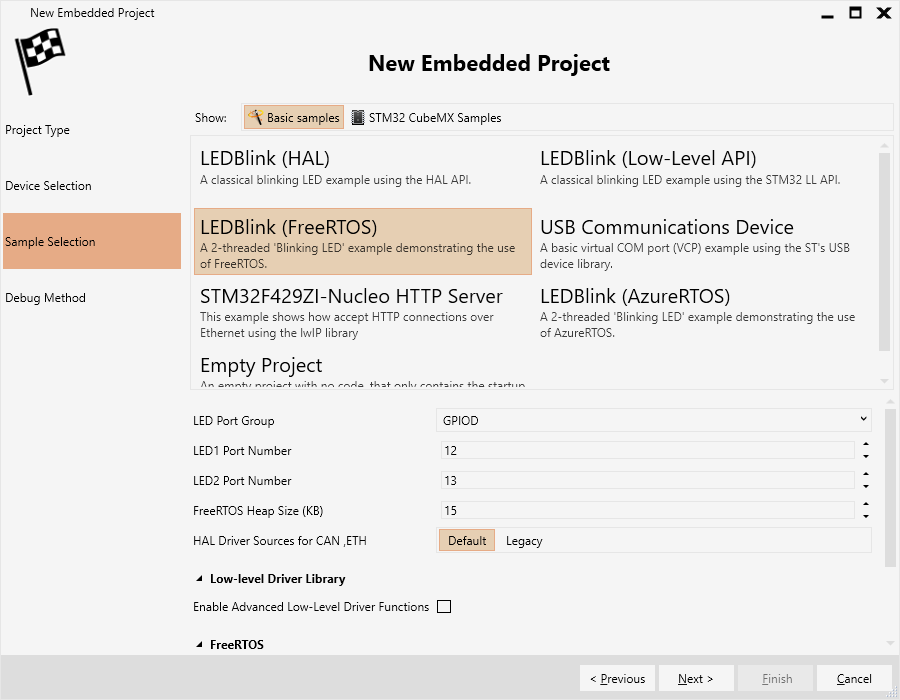
- The next page allows selecting between basic samples and the samples from the device vendor (ST). In this tutorial we will demonstrate some advanced debugging tricks, so select the LEDBlink (FreeRTOS) tutorial:
- The last page allows selecting the debug method. On Windows CodeVROOM can automatically detect common USB-based debuggers, so plug in your ST-Link and select it in the list:
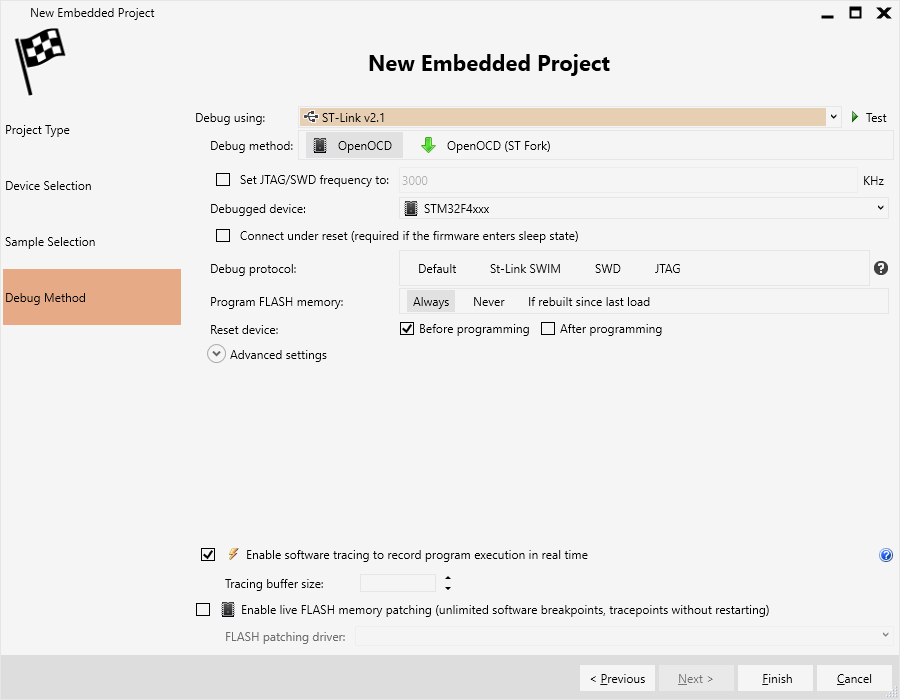
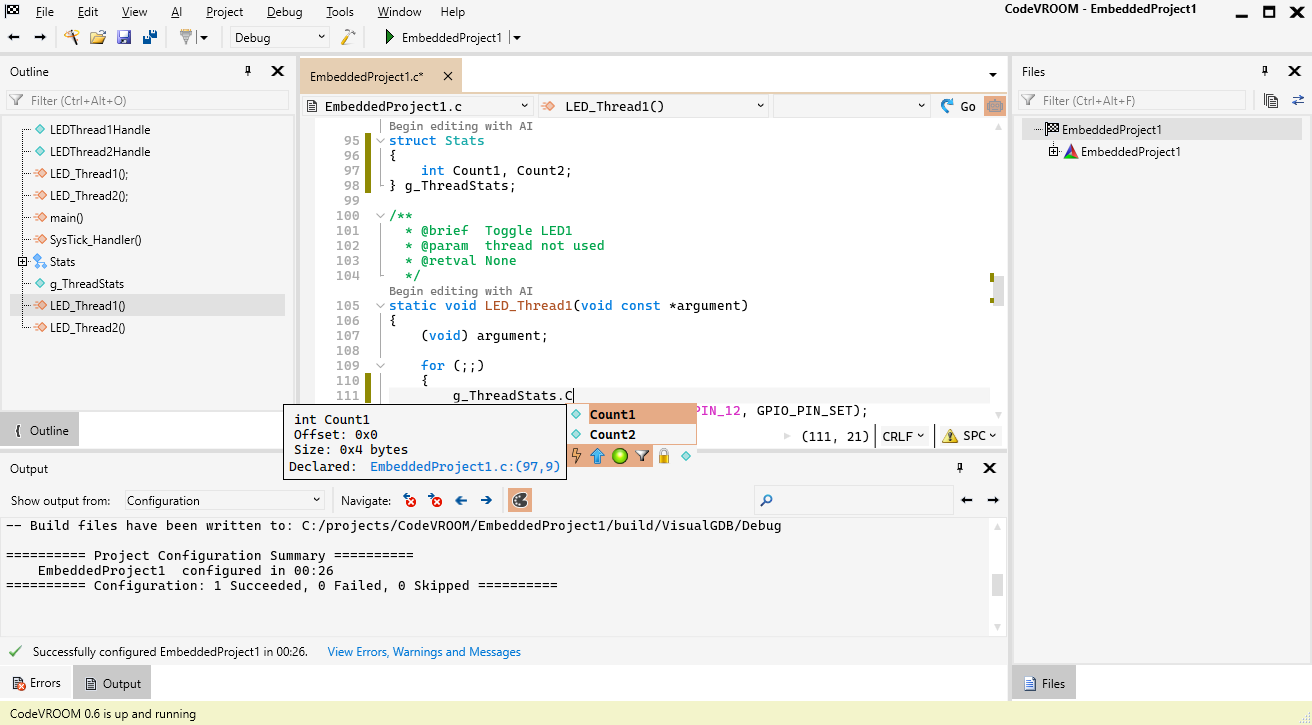
- Press “Finish” to create the project. Before we start debugging it, add a g_ThreadStats struct above the threads and modify both threads to increment one field in the struct:
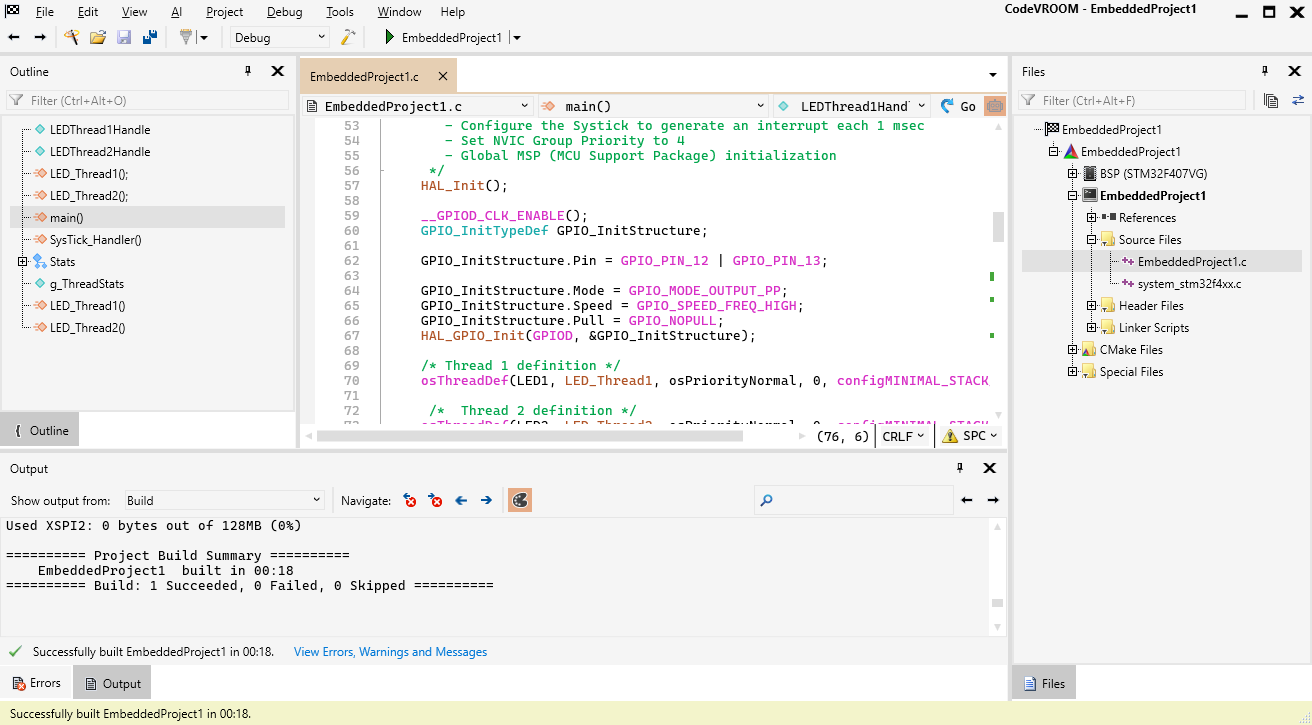
- Once the project is loaded, use the Project->Build command to build it:
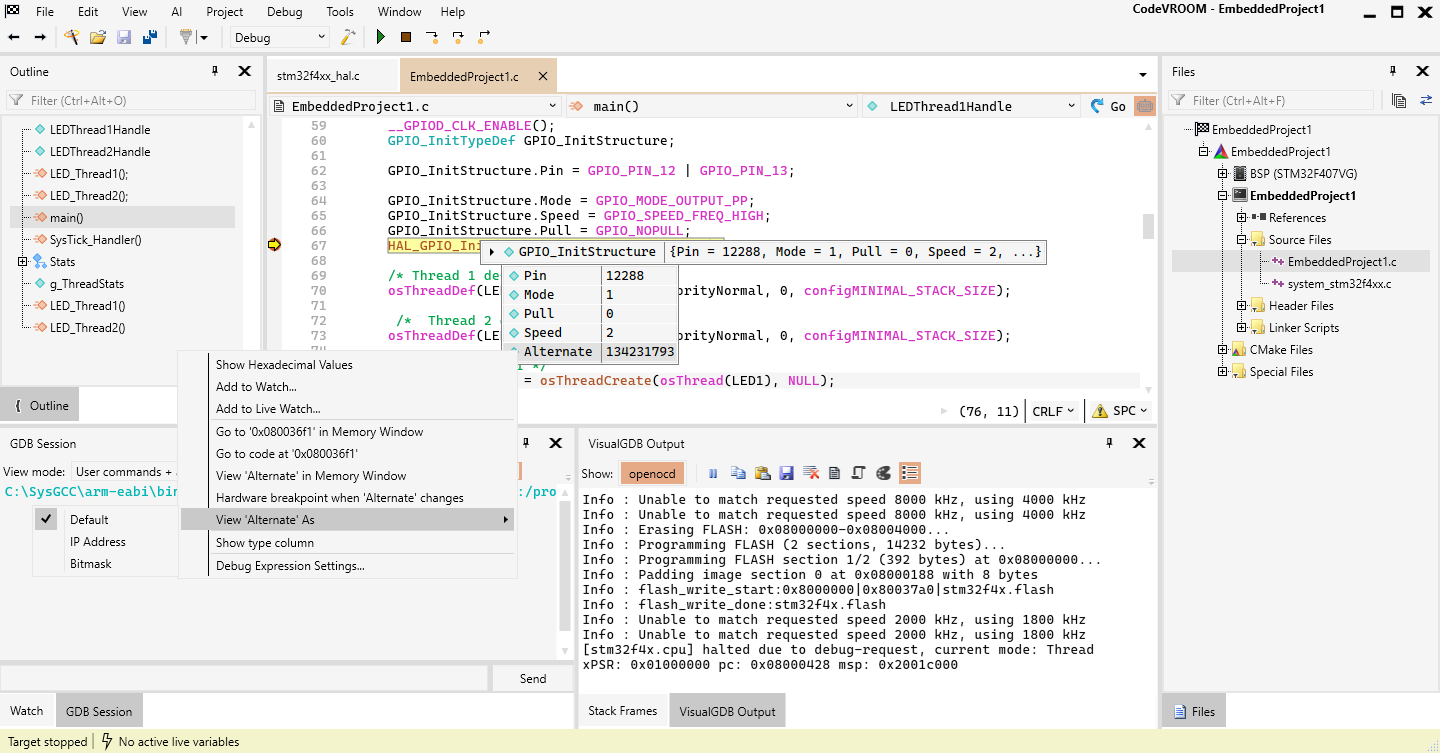
- Set a breakpoint on the line calling HAL_GPIO_Init(), and start debugging. Once the breakpoint hits, you can hover the mouse over various variables to see their values. Use the context menu to quickly access other tool windows, or customize the view. E.g. you can configure the primary view to be Decimal+Hex, and the secondary view to be Binary.
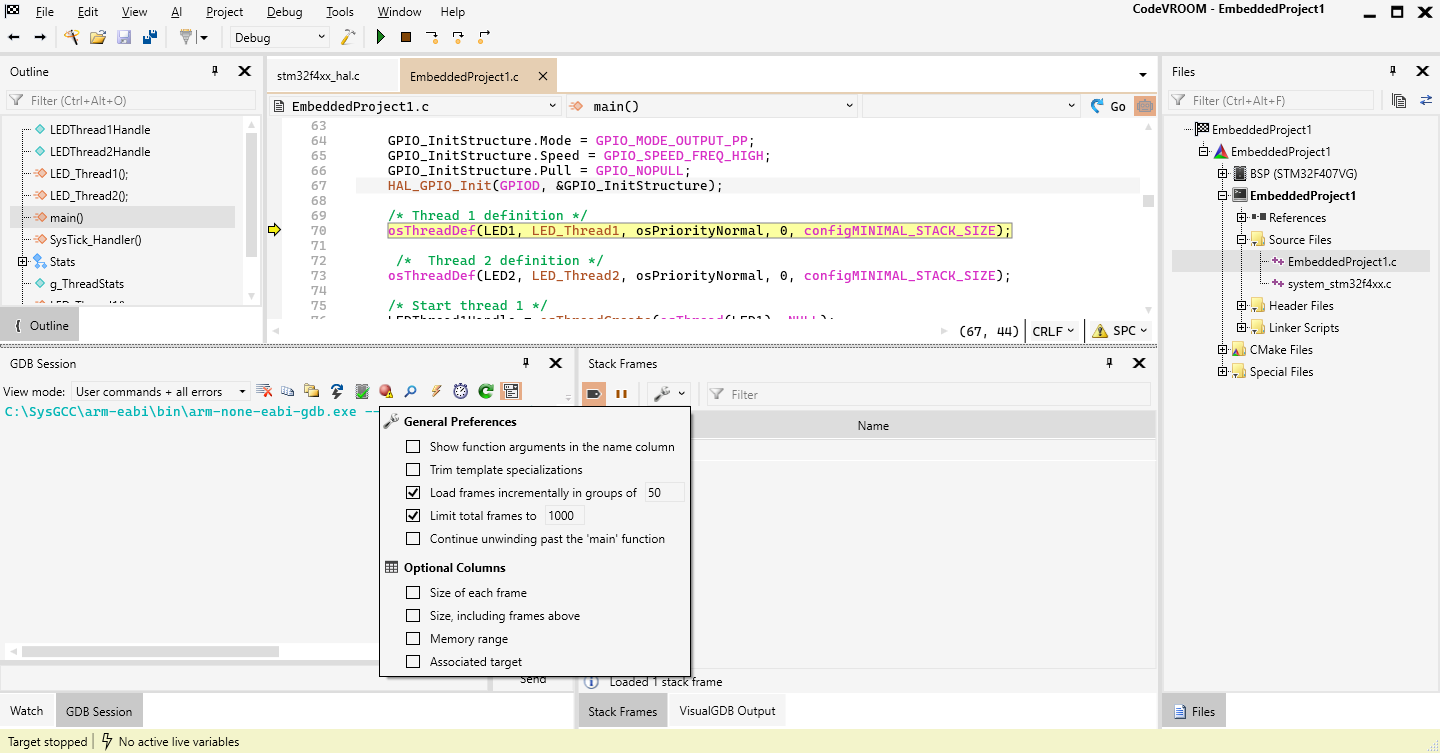
- The Stack Frames windows is also highly configurable. You can easily unwind the stack all the way to the entry point, or limit the number of loaded frames, or view the size of each stack frame, if you are trying to analyze the memory use:
- Resume the session and hover the mouse over g_ThreadStats. CodeVROOM will display the live values as if the program was stopped:
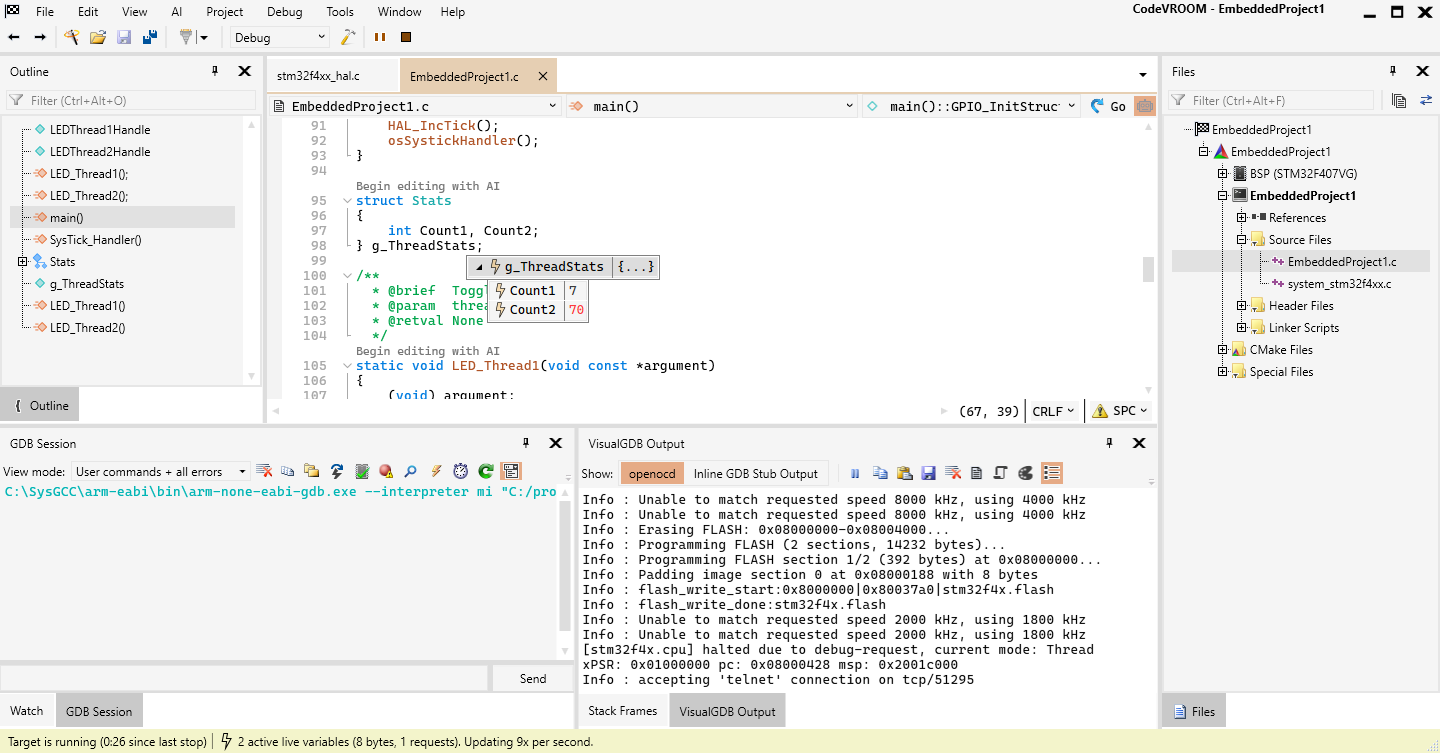 Note that it only works with global variables that can be located in memory without stopping the target. If you want to live-watch more complex expressions, you can use the dedicated Live Watch window.
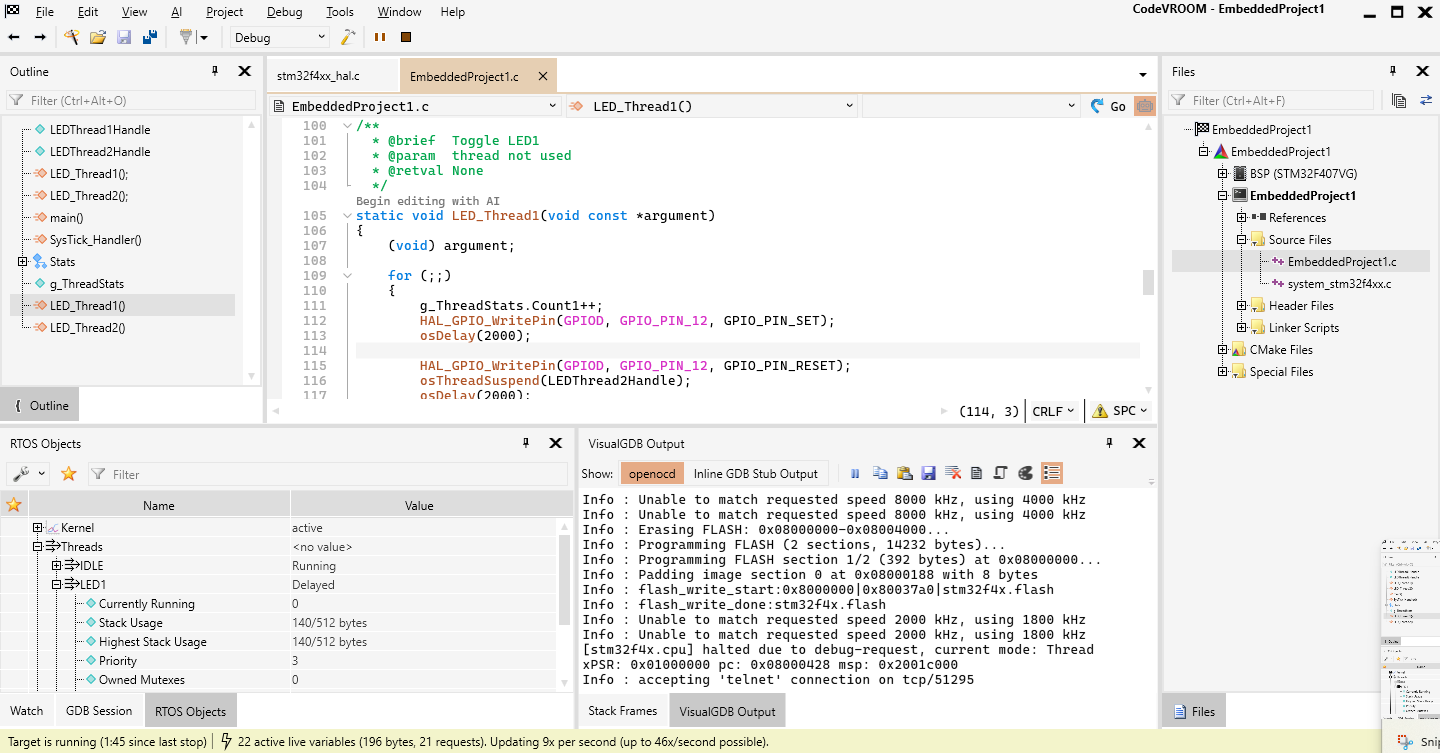
 - You can also use the Globals view to find the variables there, or use the RTOS Objects view to see live information about running threads, mutexes, etc:
- Stop the target again and open the Threads window. Note how you can instantly filter frames of all stacks by function names, and see the locations of all other threads/frames highlighted in the code:
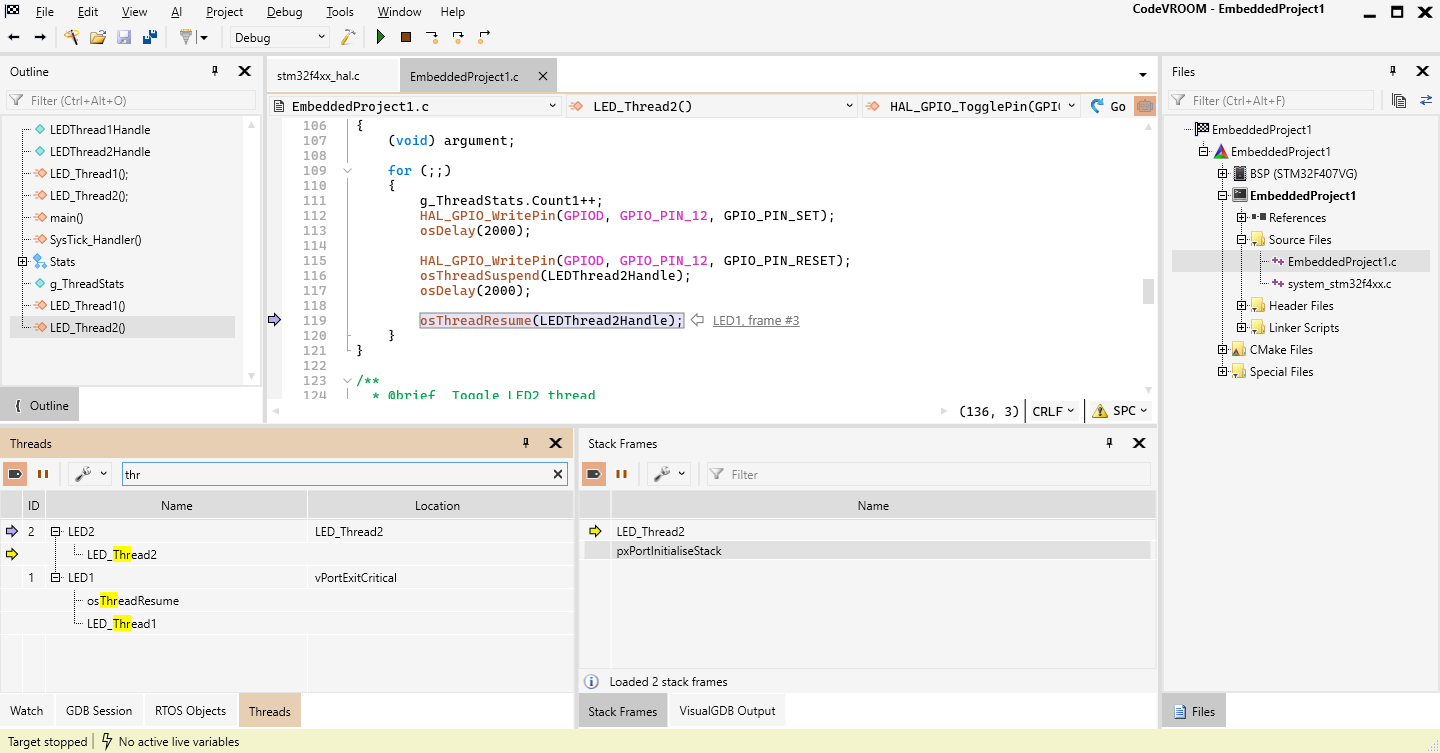 Clicking on the “LED1, frame #3” label will switch to that frame, so you can inspect the local variables.
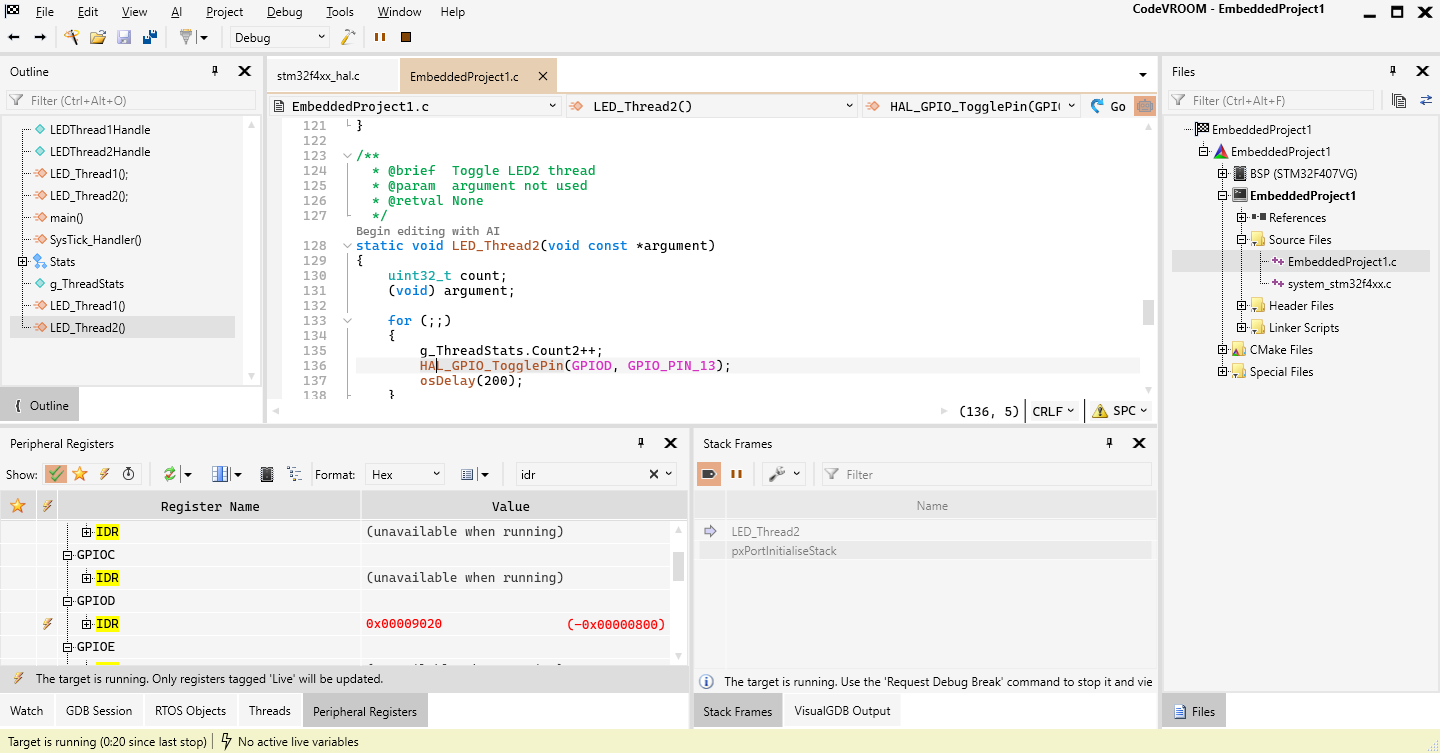
 - Open the Peripheral Registers view. Type “IDR” in the filter, so all matches get immediately highlighted and expanded. Then set the live flag on GPIOD->IDR:
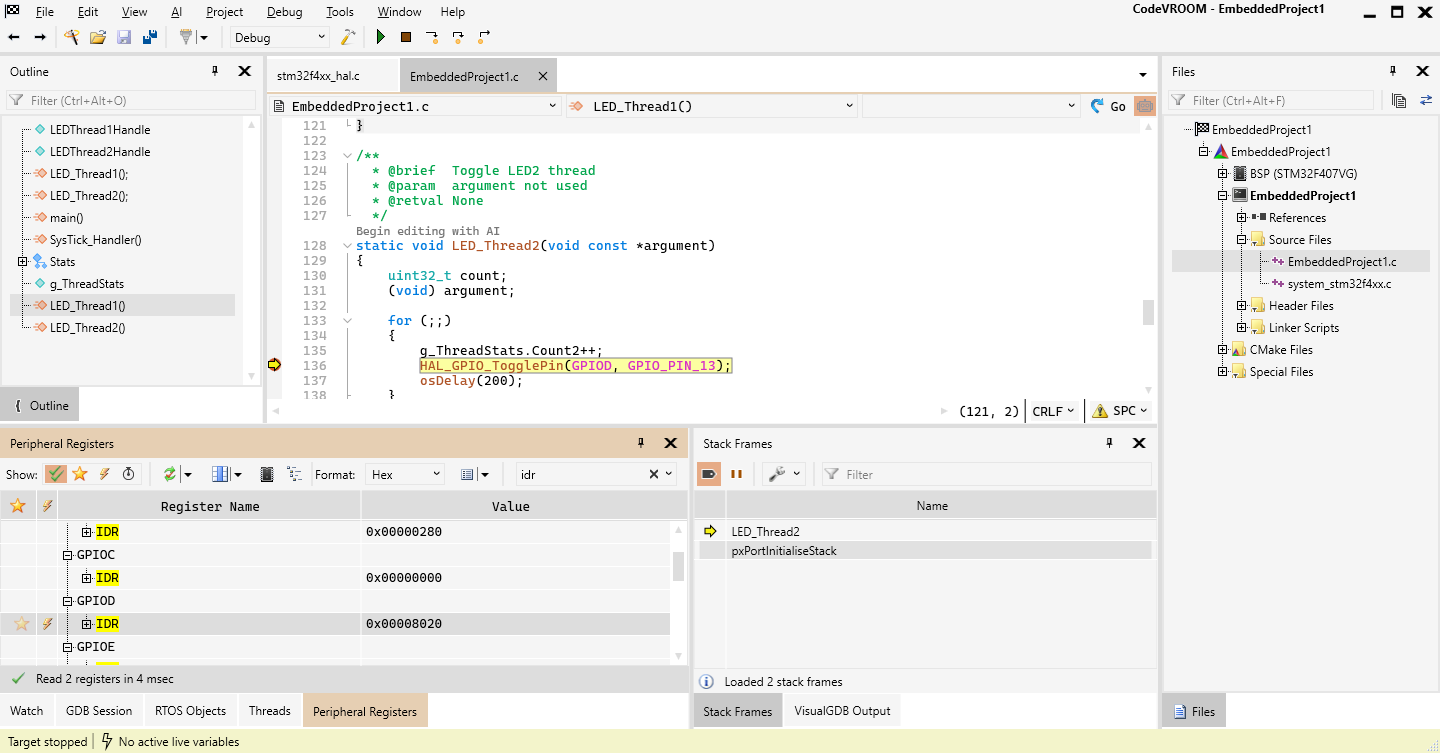
- Now you can resume the program and see how IDR (bitmask of pin states) changes in real time:
- You can edit various project properties using the “Properties” command in the Files view. The property pages are directly ported from VisualGDB, so if you have used it before, you will find them very familiar: