Editing C/C++ Code with CodeVROOM
This tutorial shows the code-editing techniques supported by the latest CodeVROOM release. Although the screenshots show a Windows system, the same features also work on Linux and MacOS.
Before you begin, follow the quickstart tutorial for Windows, Linux or MacOS to create a simple STM32-based project. Once you created and built it, follow the steps shown here to try out various editing functionality:
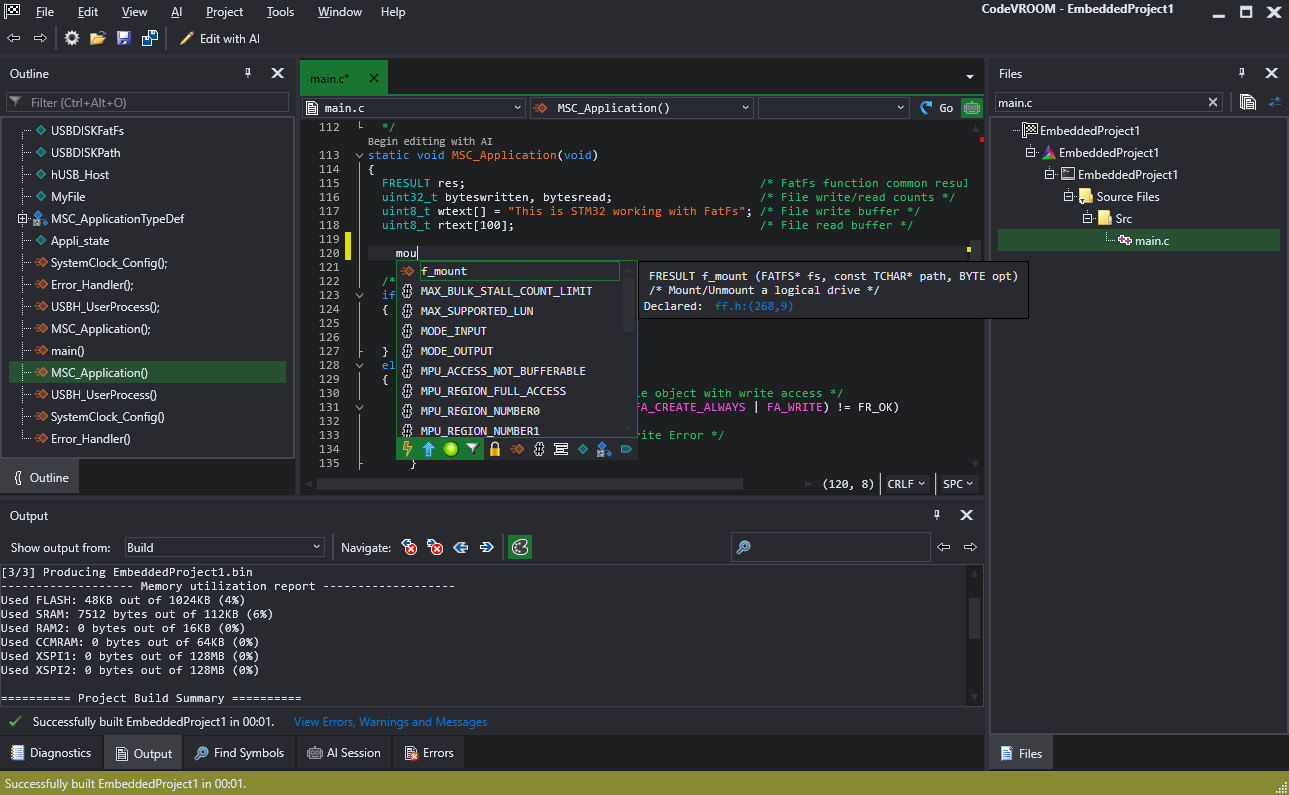
- Go to the MSC_Application() function. Let’s try calling f_mount(). CodeVROOM uses VisualGDB’s filtering logic, so it also works with incomplete string and acronyms. Try typing “mou” and f_mount will get selected:
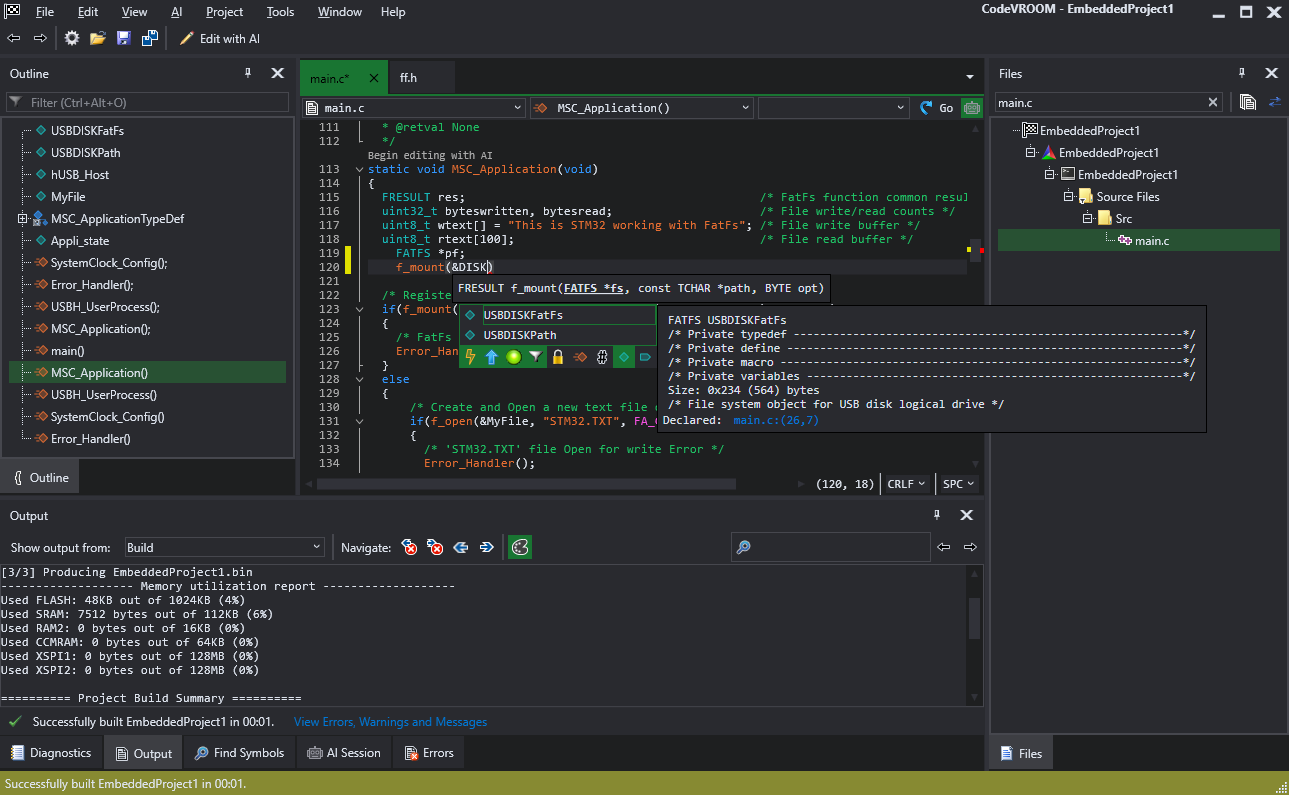
- Complete it by pressing TAB. Now we will try to the USBDISKFatFS variable. As there are many different preprocessor macros starting with DISK, the correct variable will be initially at the end of the list. You can fix this by turning on type-based filters. Click the teal diamond icon below the suggestion list, and it will be filtered to only show variables:
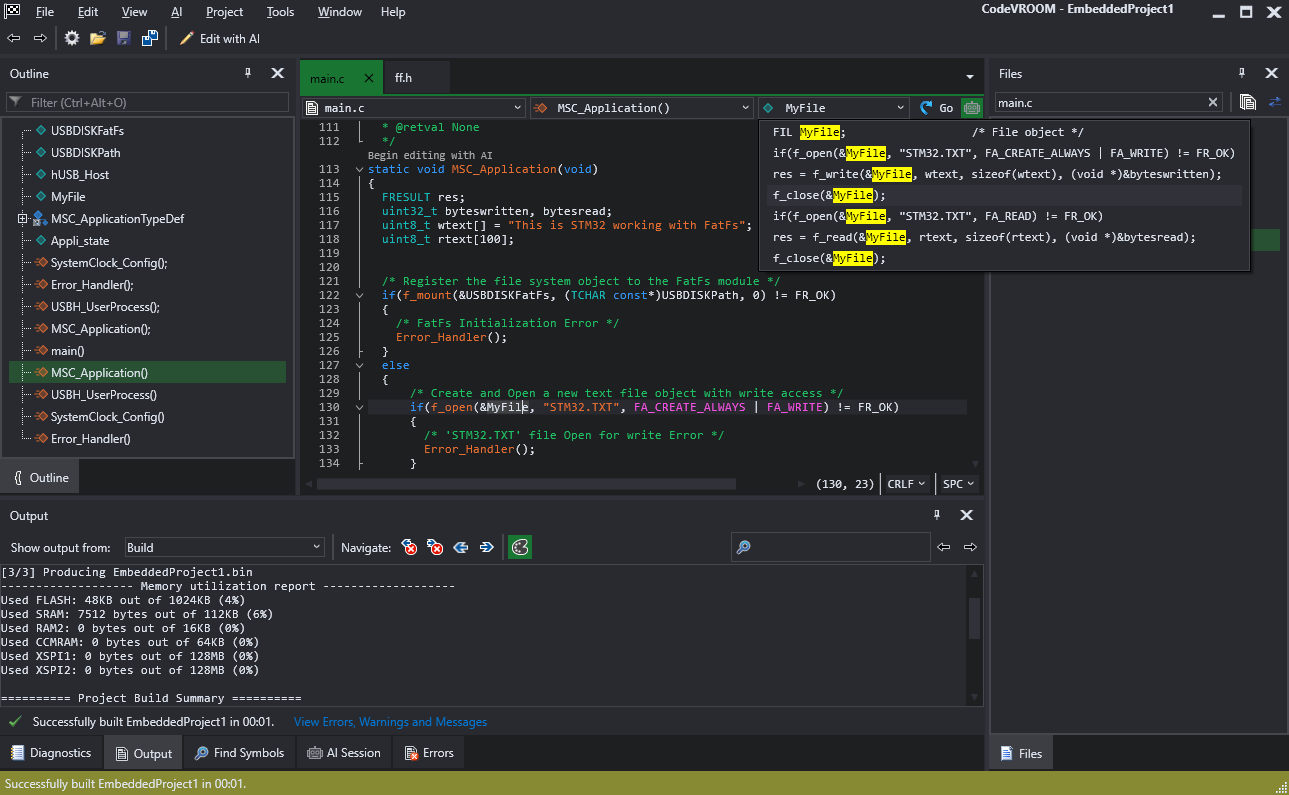
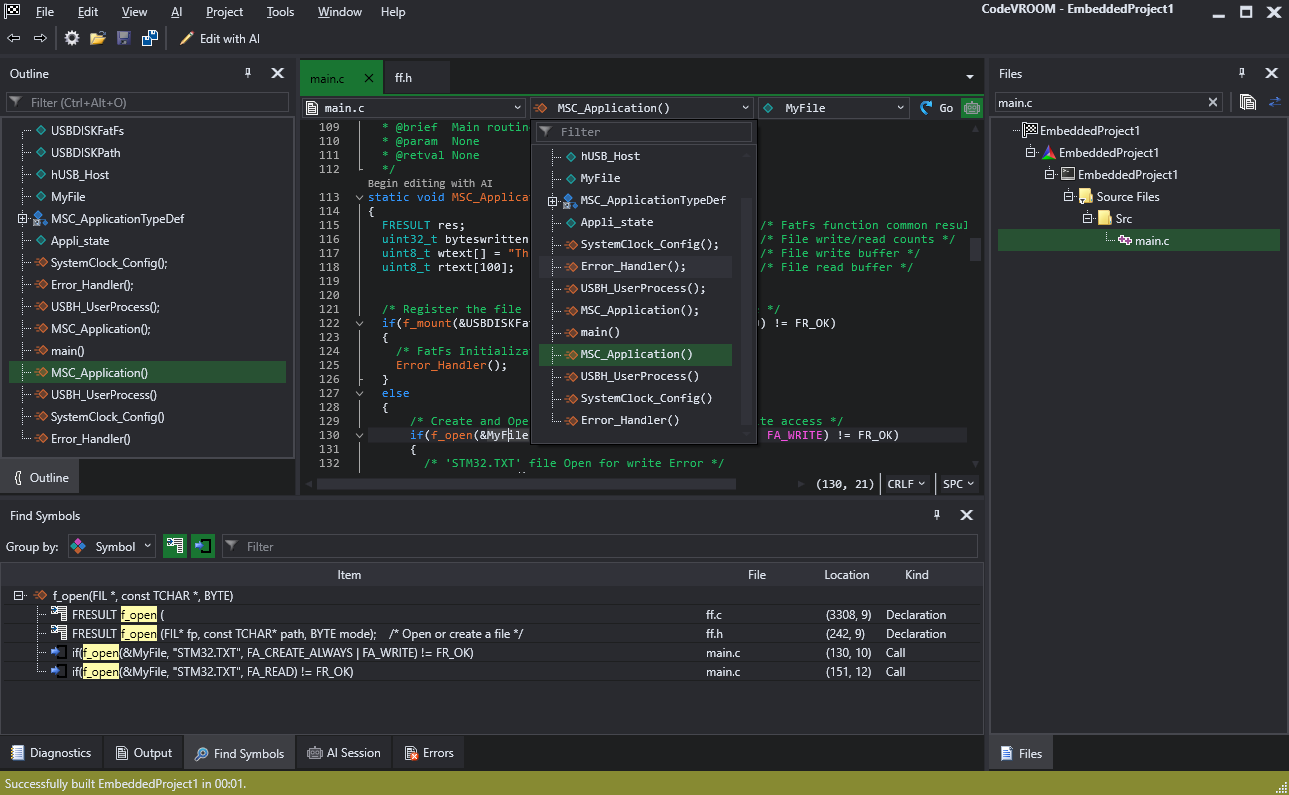
- Select the use of the MyFile variable below. Note how CodeVROOM shows that it’s a global variable (without scope) and can also display all local references to it if you use the drop-down box in the top right corner of the editor:
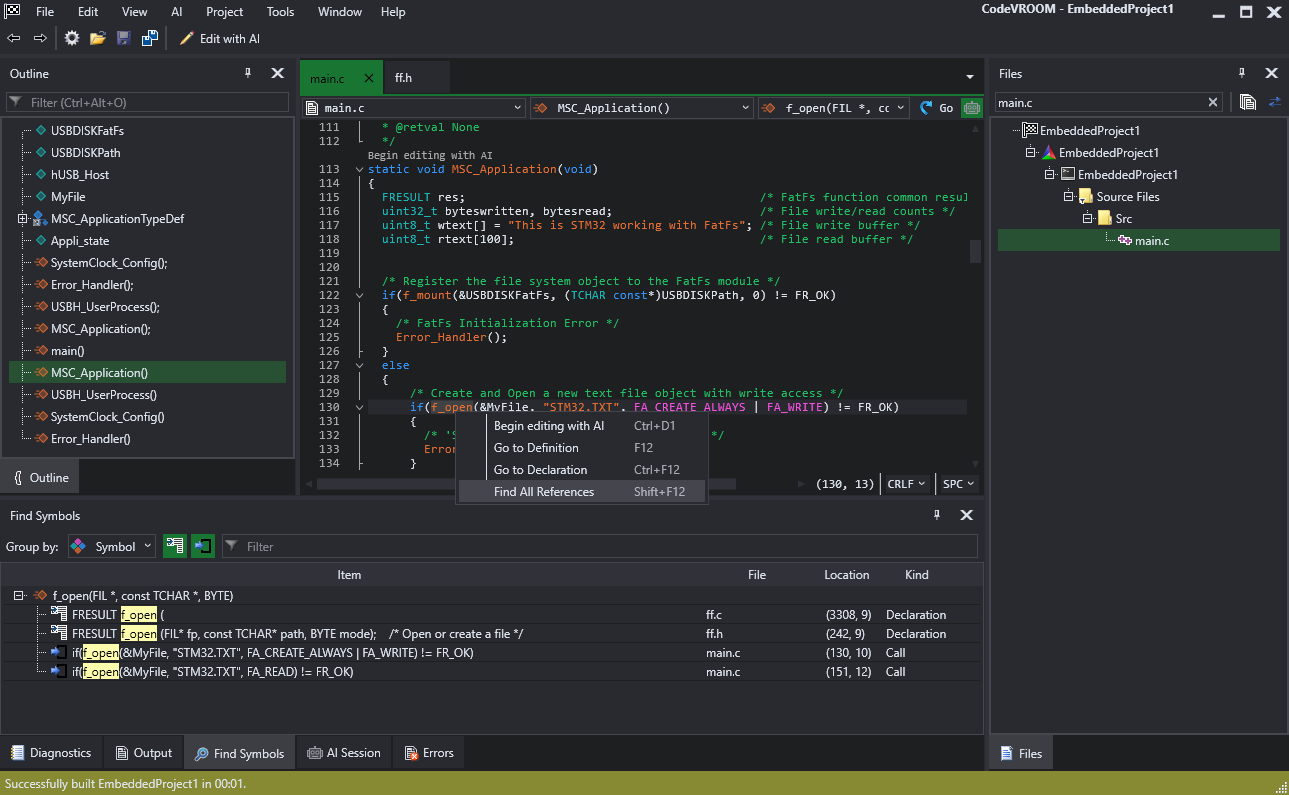
- Local references only work within the current source file. To search the entire project, right-click on f_open() and select “Find all references”:
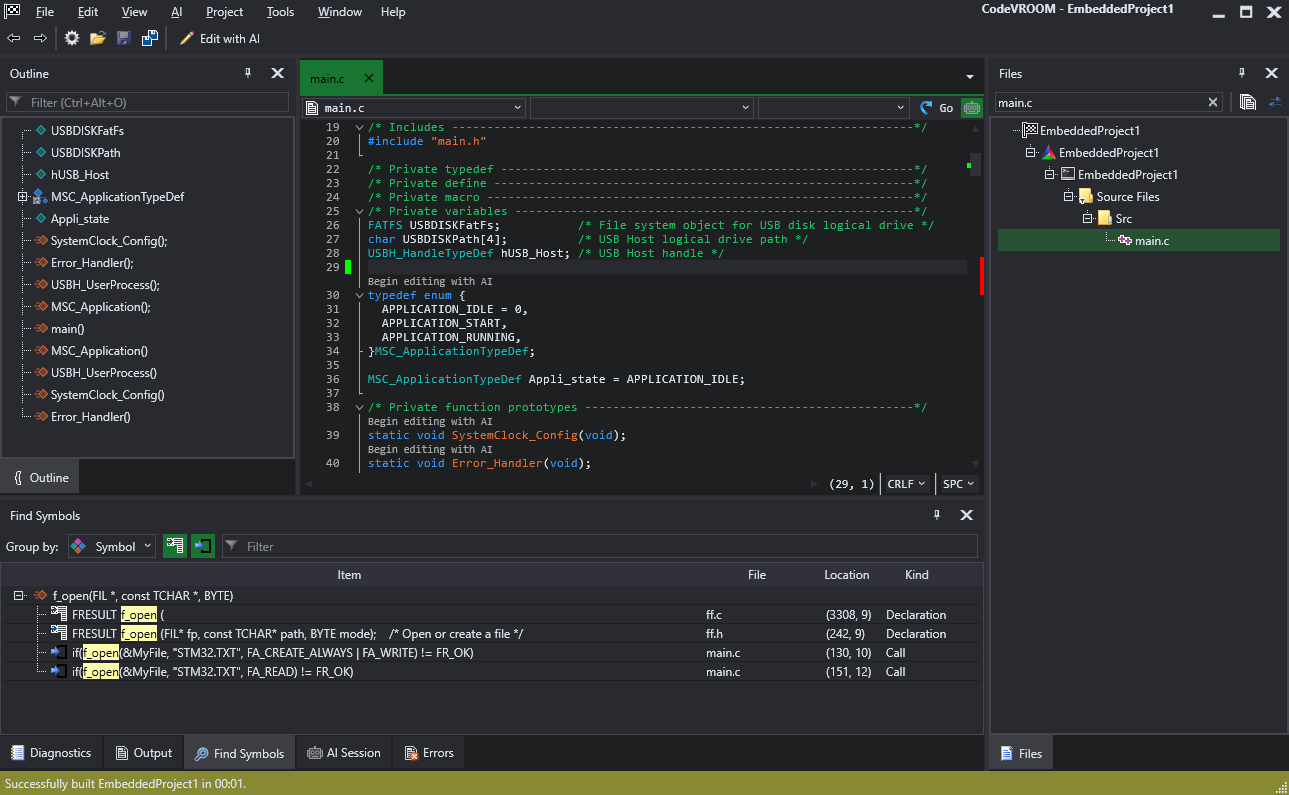
- You can use the outline window on the left, or the navigation bar on top of the editor to quickly jump between different symbols in the file:
- Go to the definition of MyFile and delete the line containing it. Note how the scrollbar highlights a cluster of errors in the lines referring to it:
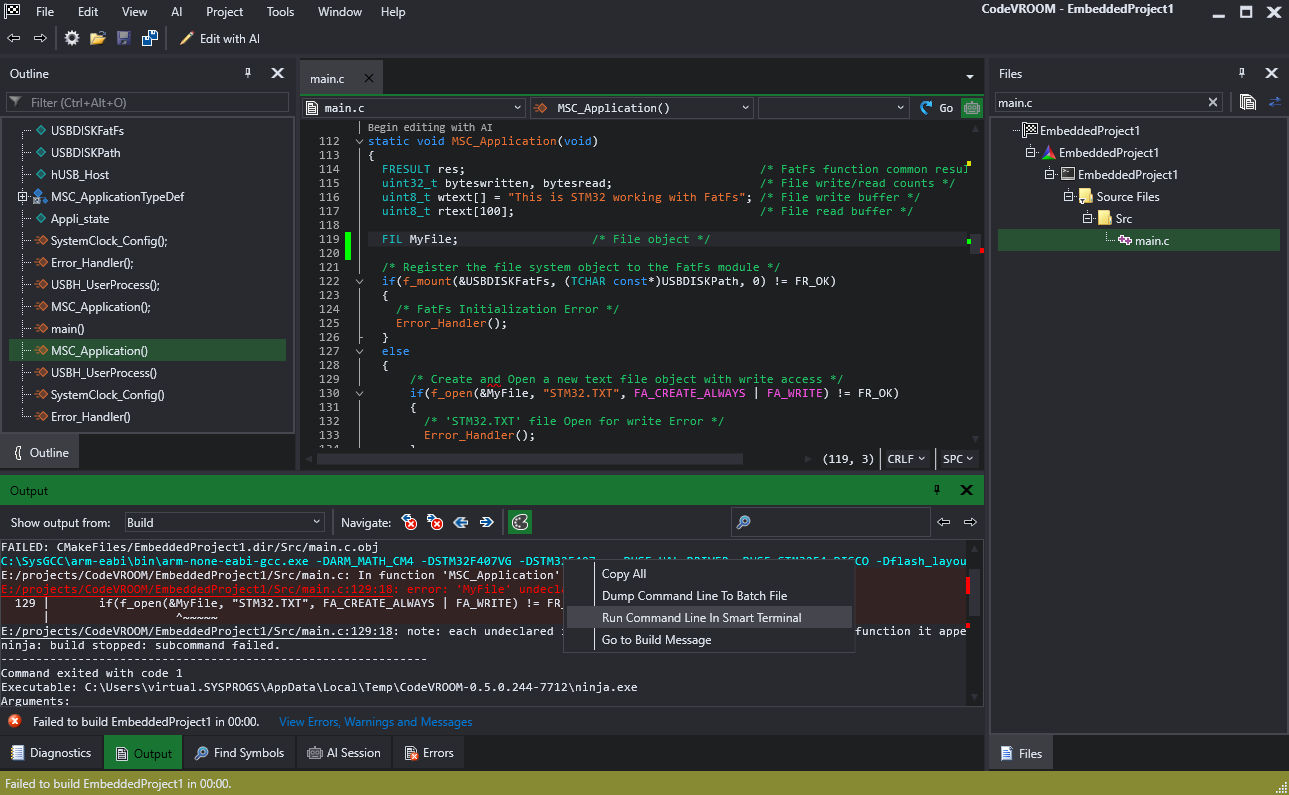
- Try building the project. Note how GCC only reported the first occurrence of the missing symbol, while the Clang-based Quick Check found all of them. To distinguish between the Quick Check errors and build errors, the former are shown with the lightning symbol:
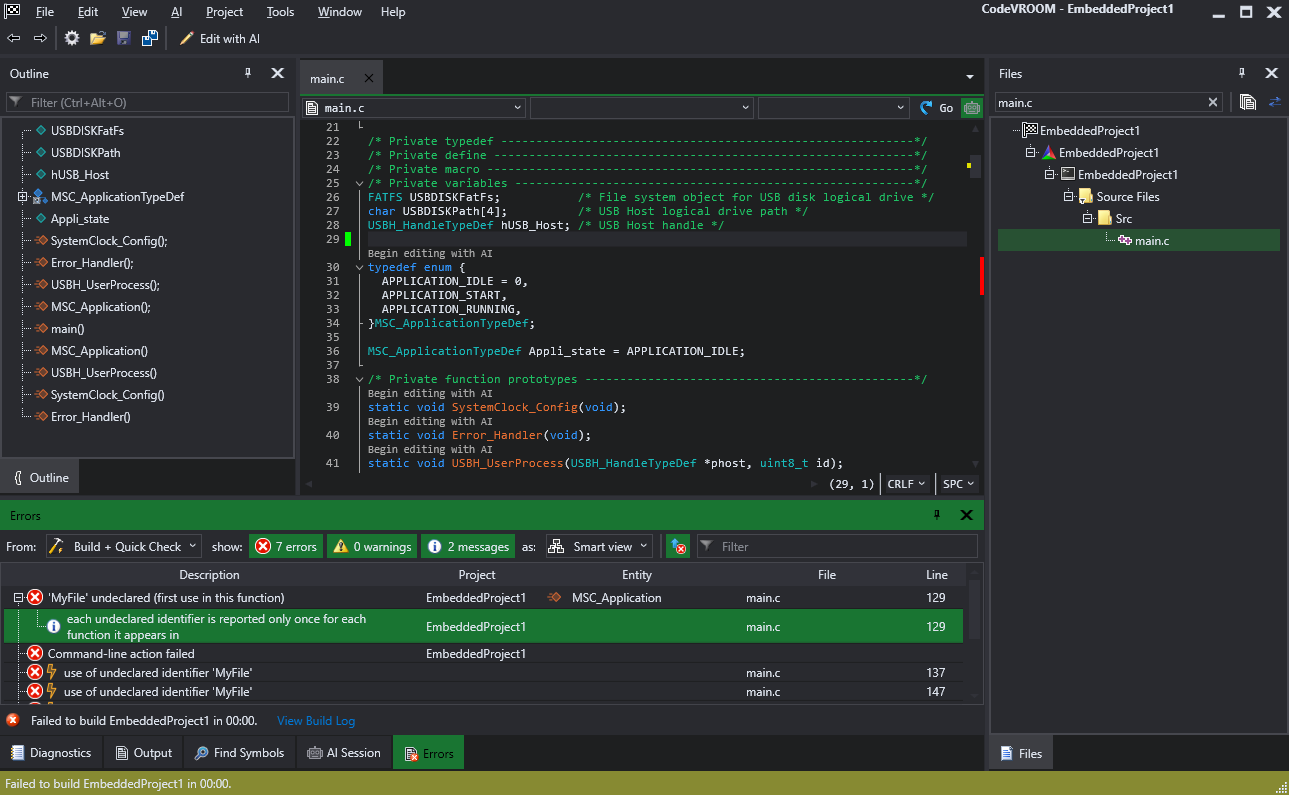 You can use the filtering controls in the errors window to switch between viewing both of error sources, or just one.
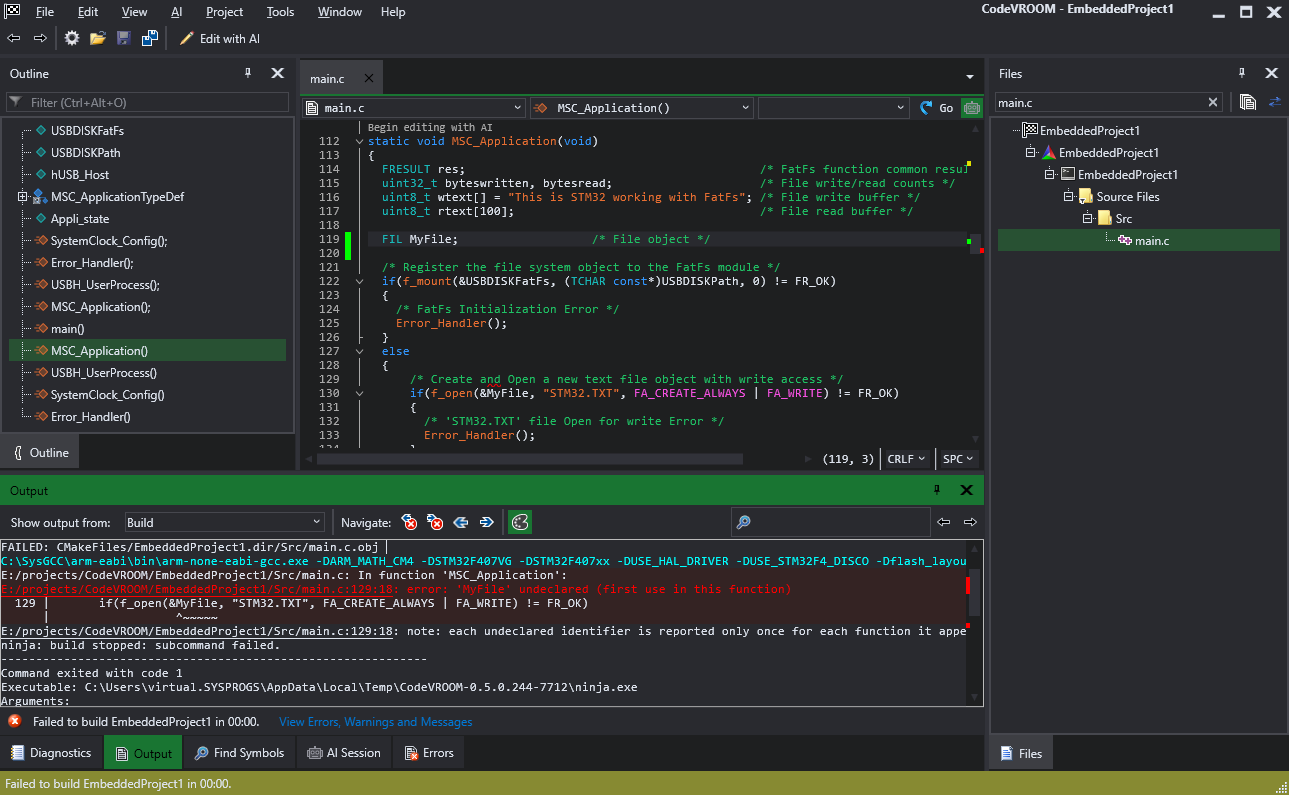
 - Switch to the Output window. The CMake output parser automatically recognizes command lines reported by Ninja and shows them in cyan:
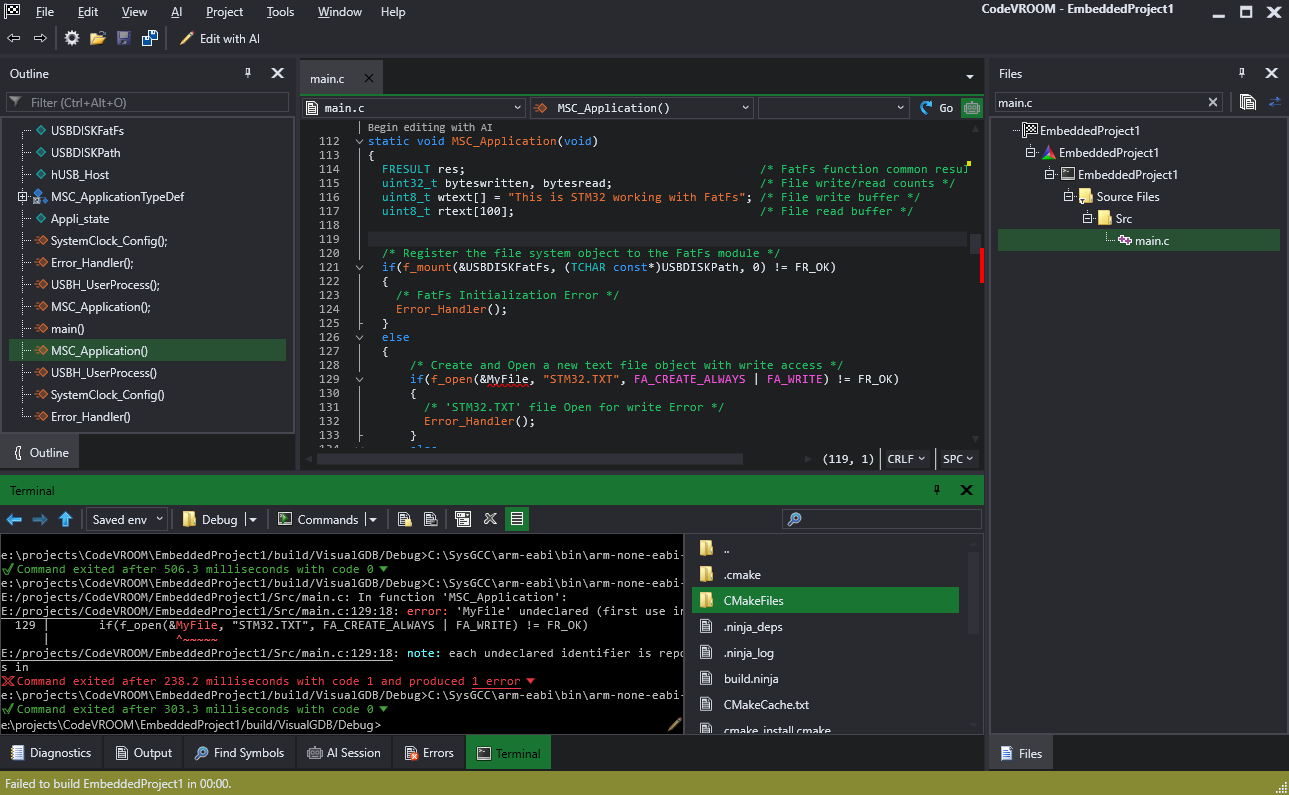
- Right-click on the GCC invocation and select “Run in Smart Terminal”:
- This will copy the entire command line (including the environment) to the terminal, and will run it:
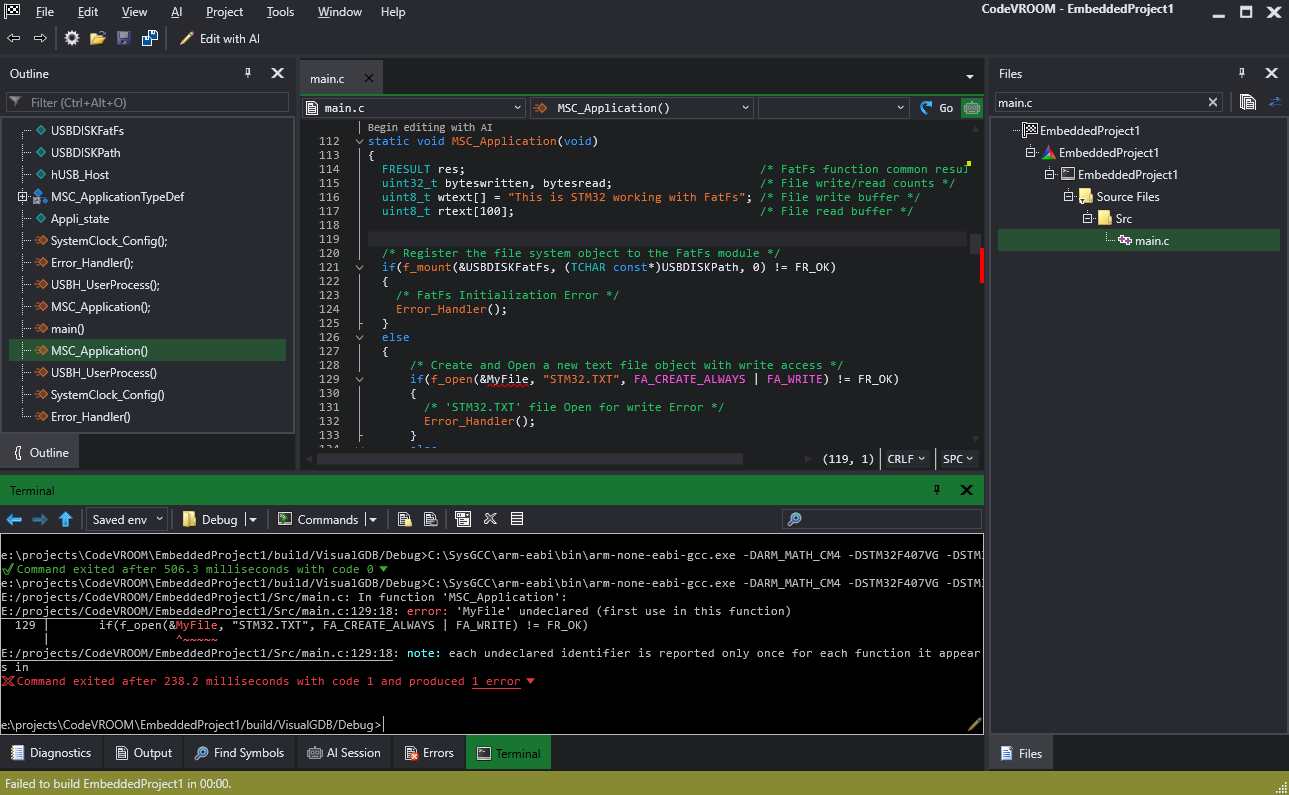 Note that you can import the error messages from the terminal back into the Errors window by clicking the “N errors” link.
 - Press ‘Up’ to show the command line again, and click the edit button in the bottom right corner. This will open a multi-line edit window for the command line:
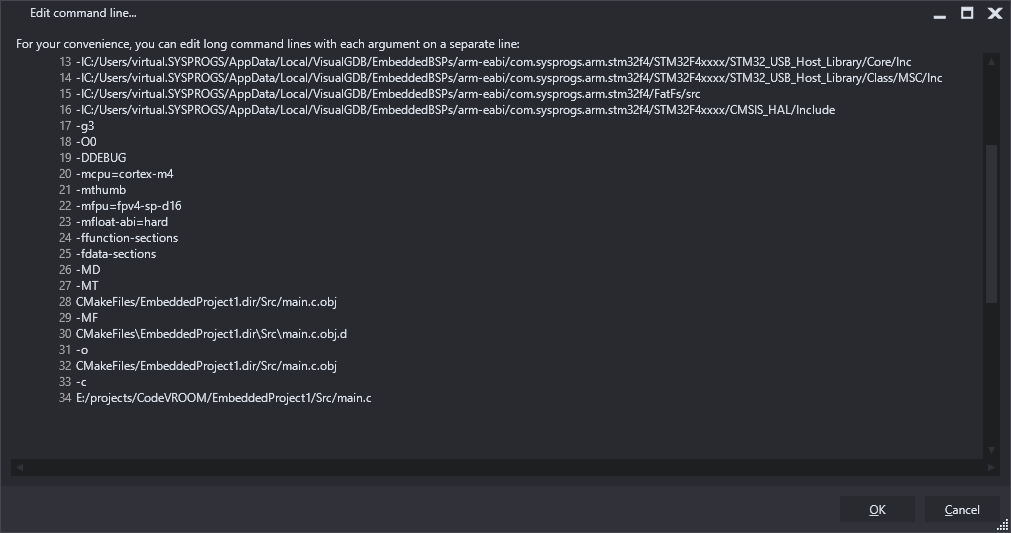
- Change it to preprocess the file instead of compiling it:
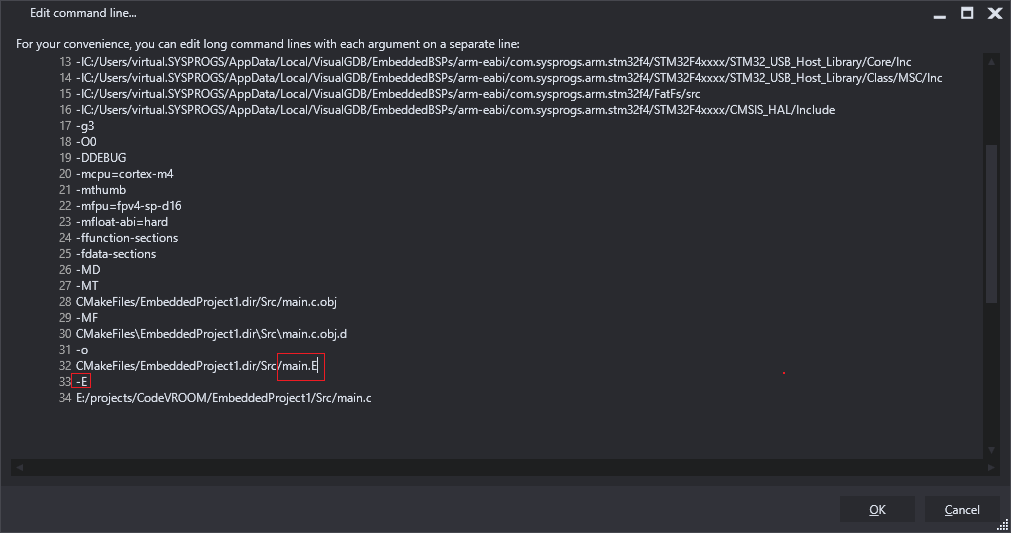
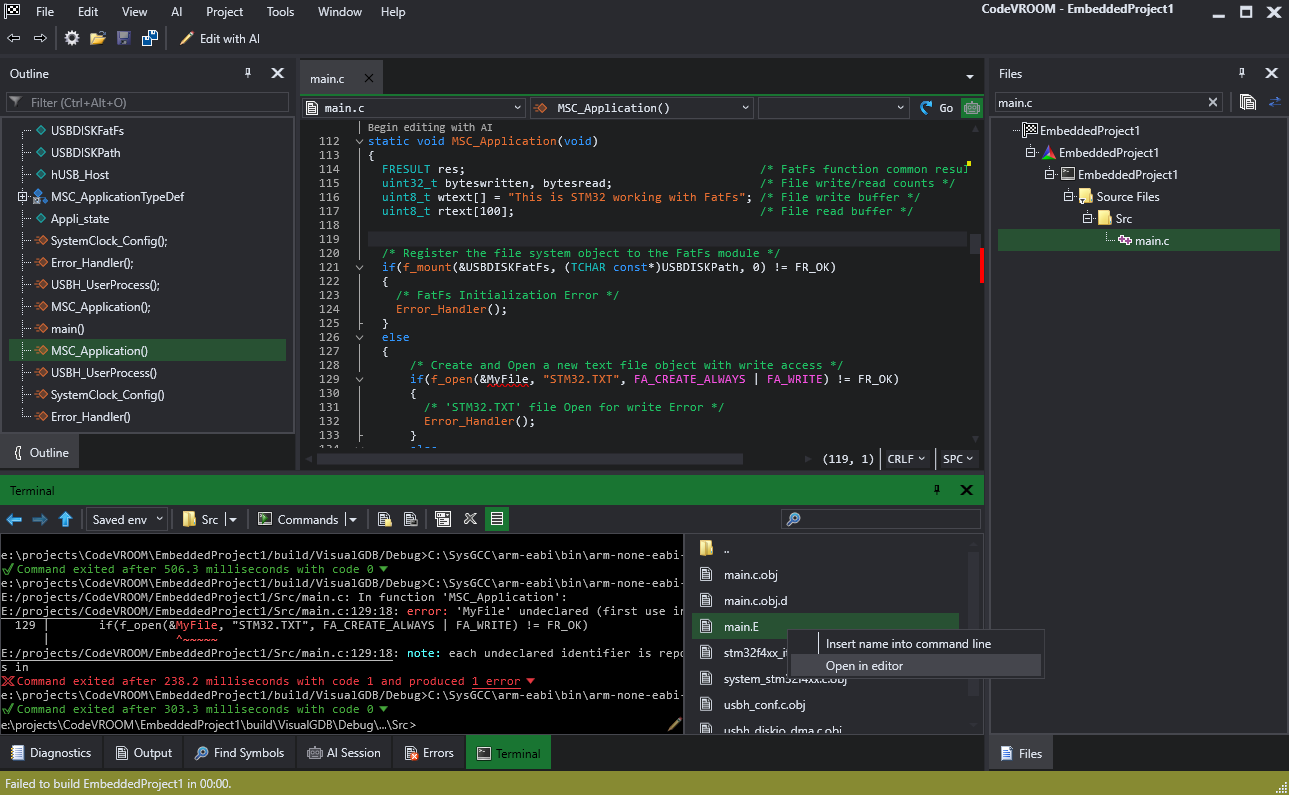
- You can easily locate the preprocessing output by using the file panel. Enable it via the toolbar and navigate to CMakeFiles/EmbeddedProject1.dir/Src:
- Right-click on the main.E file and select “Open in Editor”:
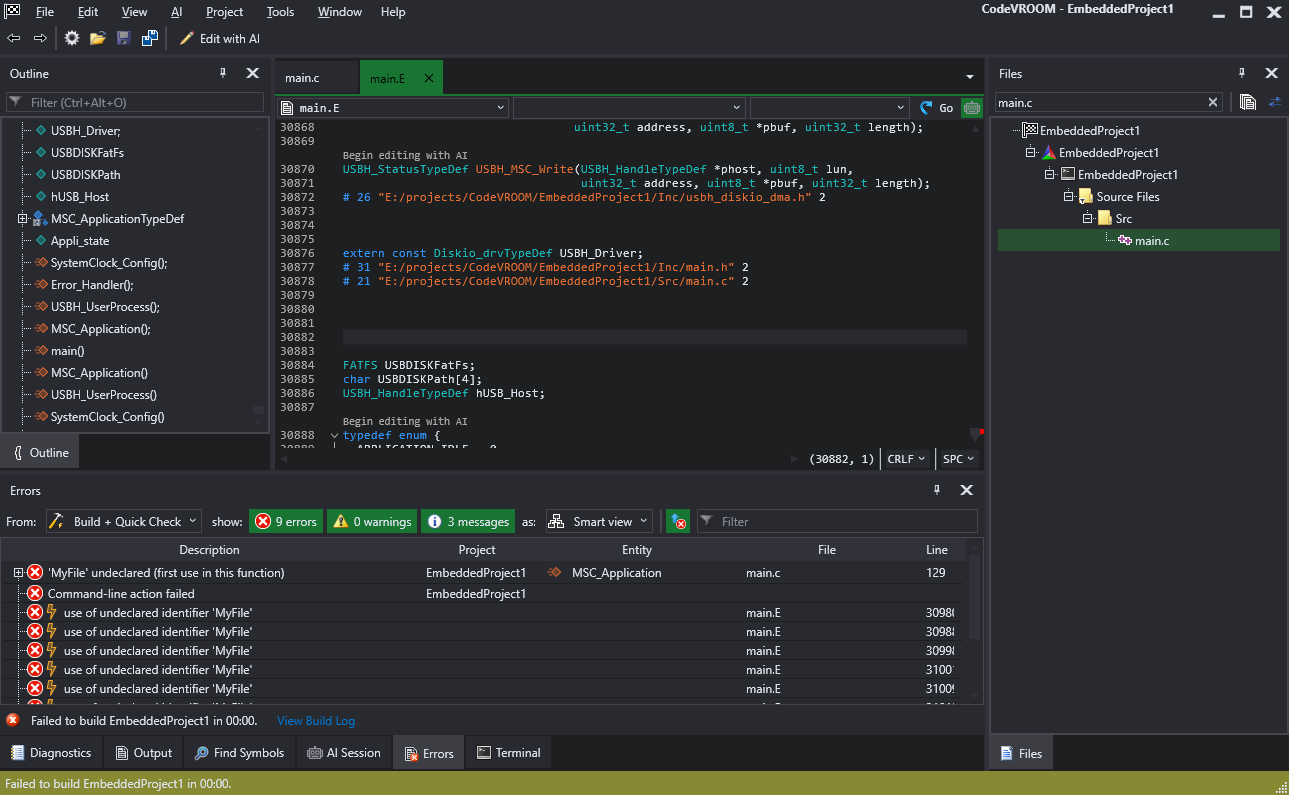
- This will temporarily attach the file to the active project, so the Clang engine will parse it and display the outline. You can use it to quickly find the relevant parts and troubleshoot errors related to preprocessor macros:
More features are coming soon. Follow us on X for updates.