Creating Embedded Projects on MacOS
This tutorial shows how to use CodeVROOM to create a basic STM32 project on MacOS.
Before you begin, install Homebrew and get the gcc-arm-embedded, ninja-build, cmake, openocd and xz packages.
Then, download the latest CodeVROOM and mount the DMG file.
- CodeVROOM for MacOS can run both from the DMG file and the application folder. In this tutorial we will just simply run it directly:
- Once loaded, the main window will look like this:
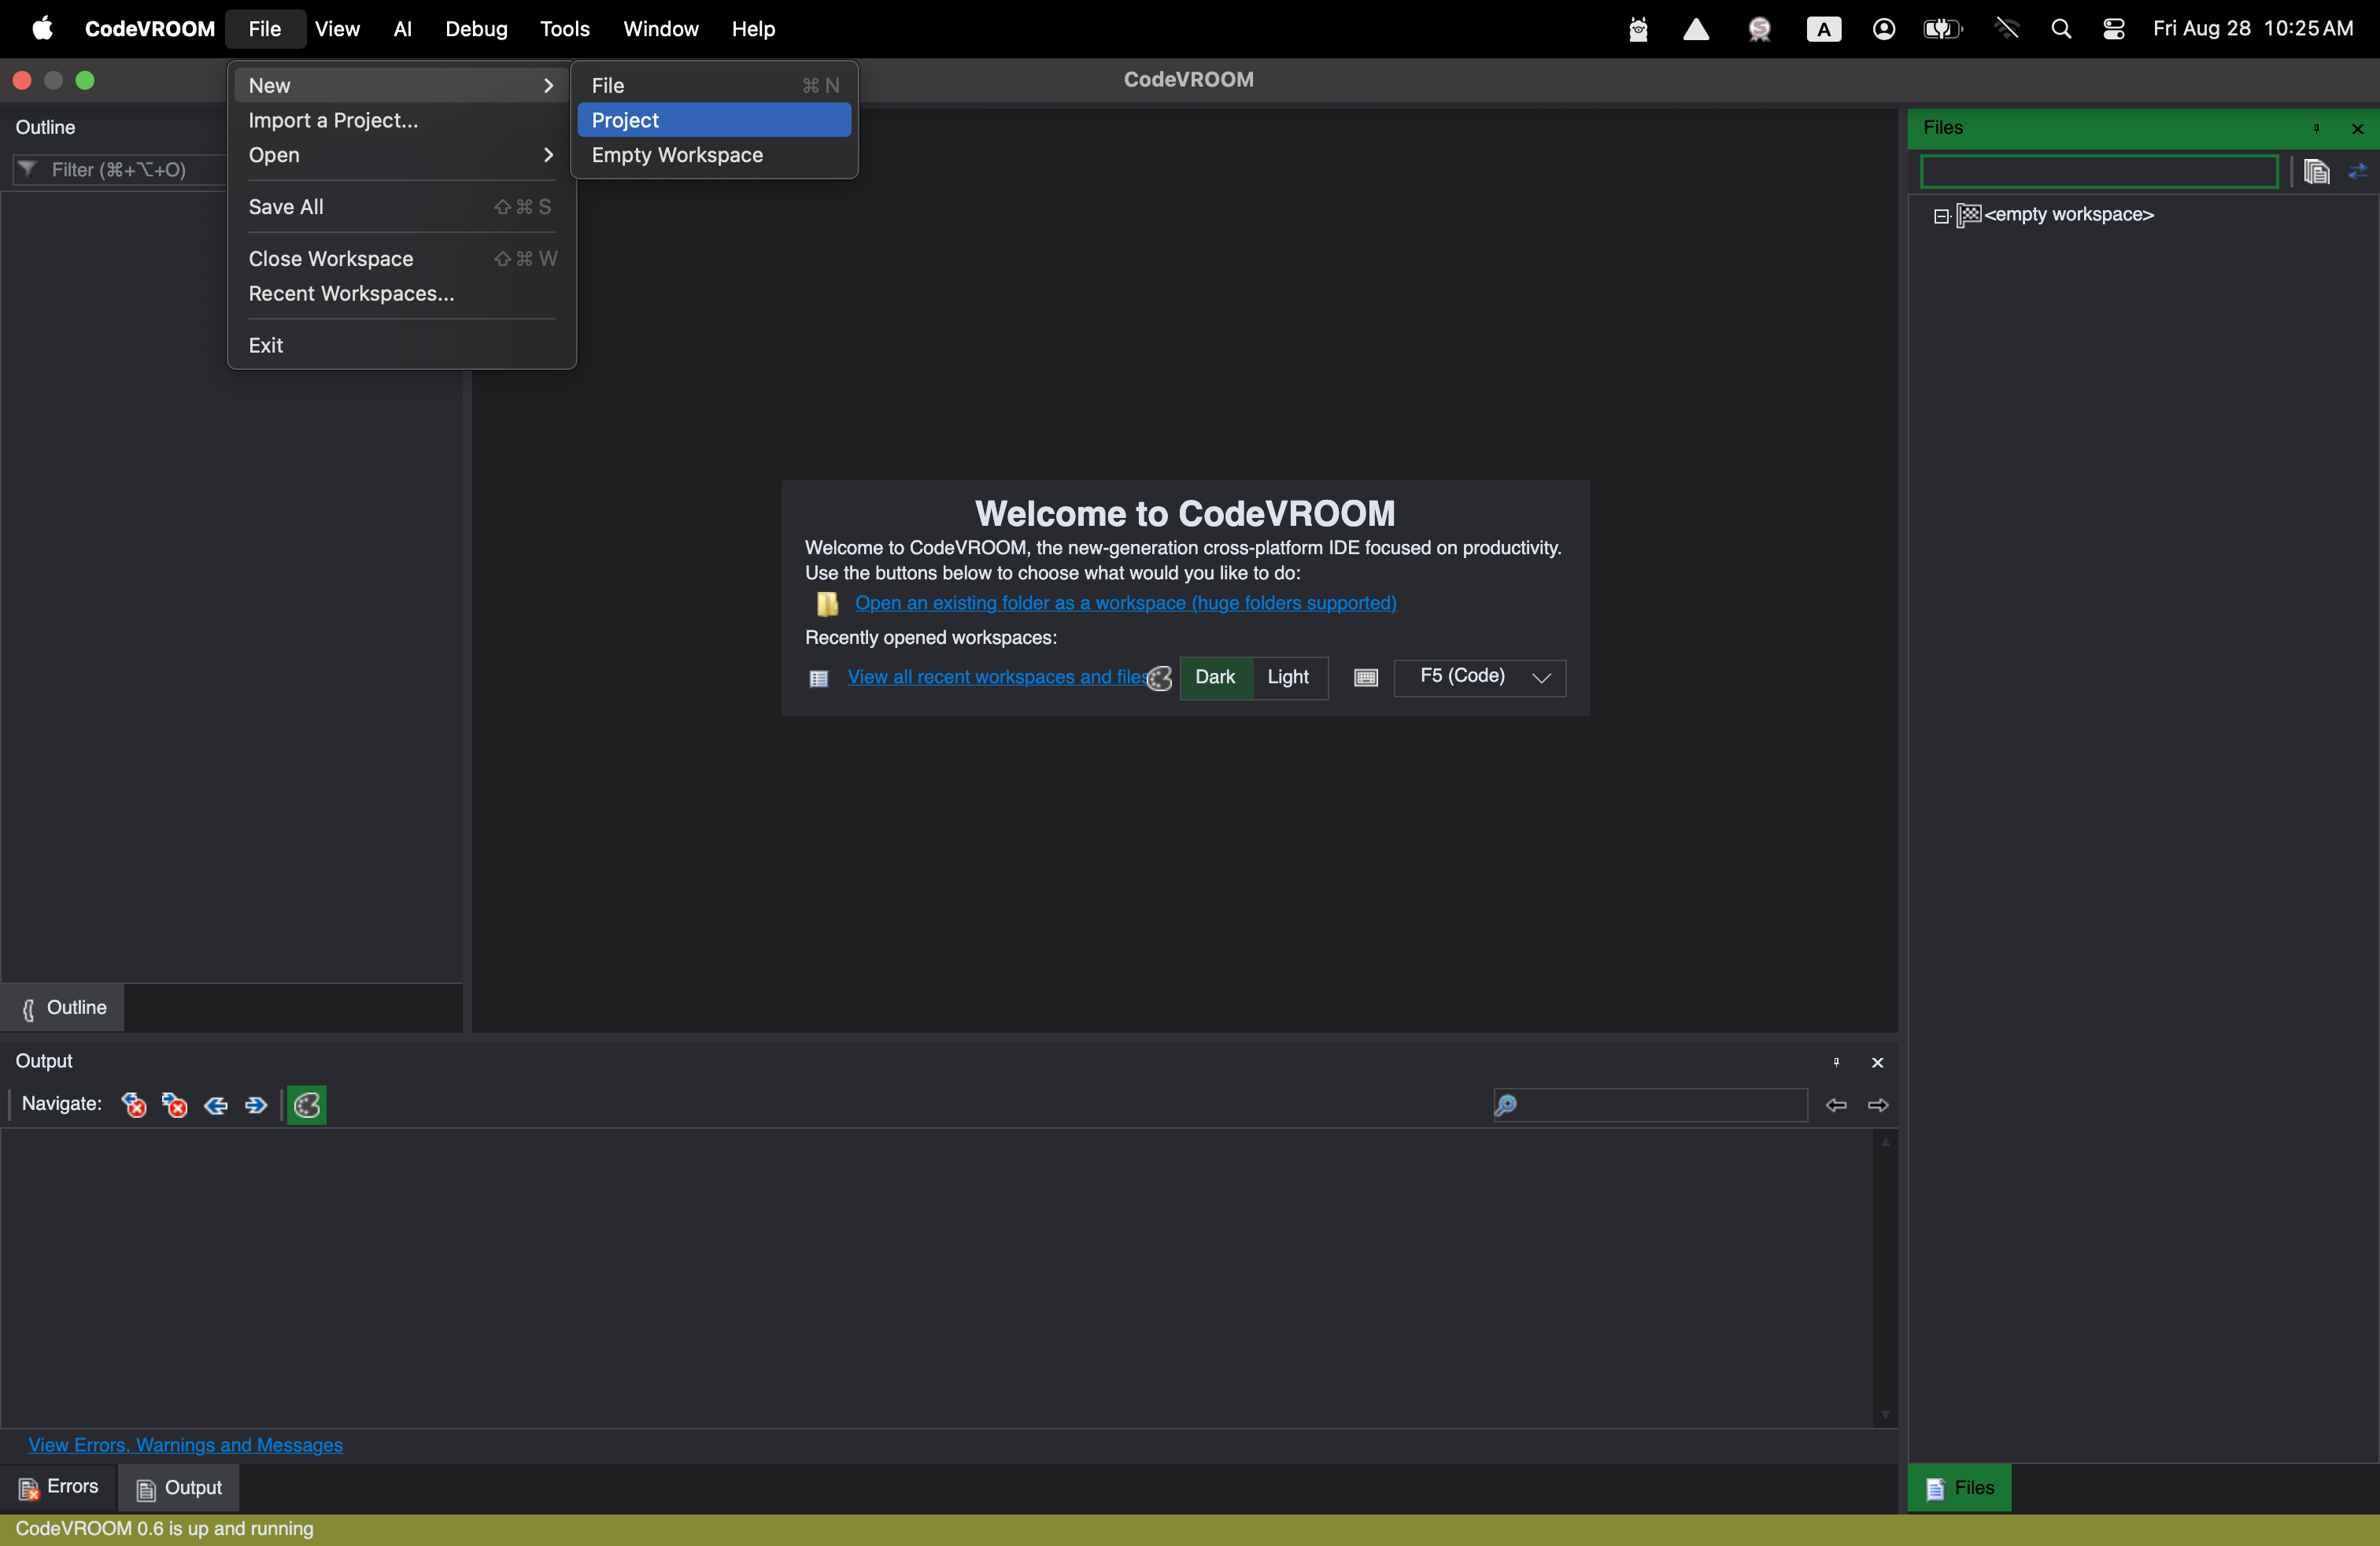
- Use the File->New->Project command (or the toolbar button) to start creating a new project. Select the Embedded C/C++ Project Wizard:
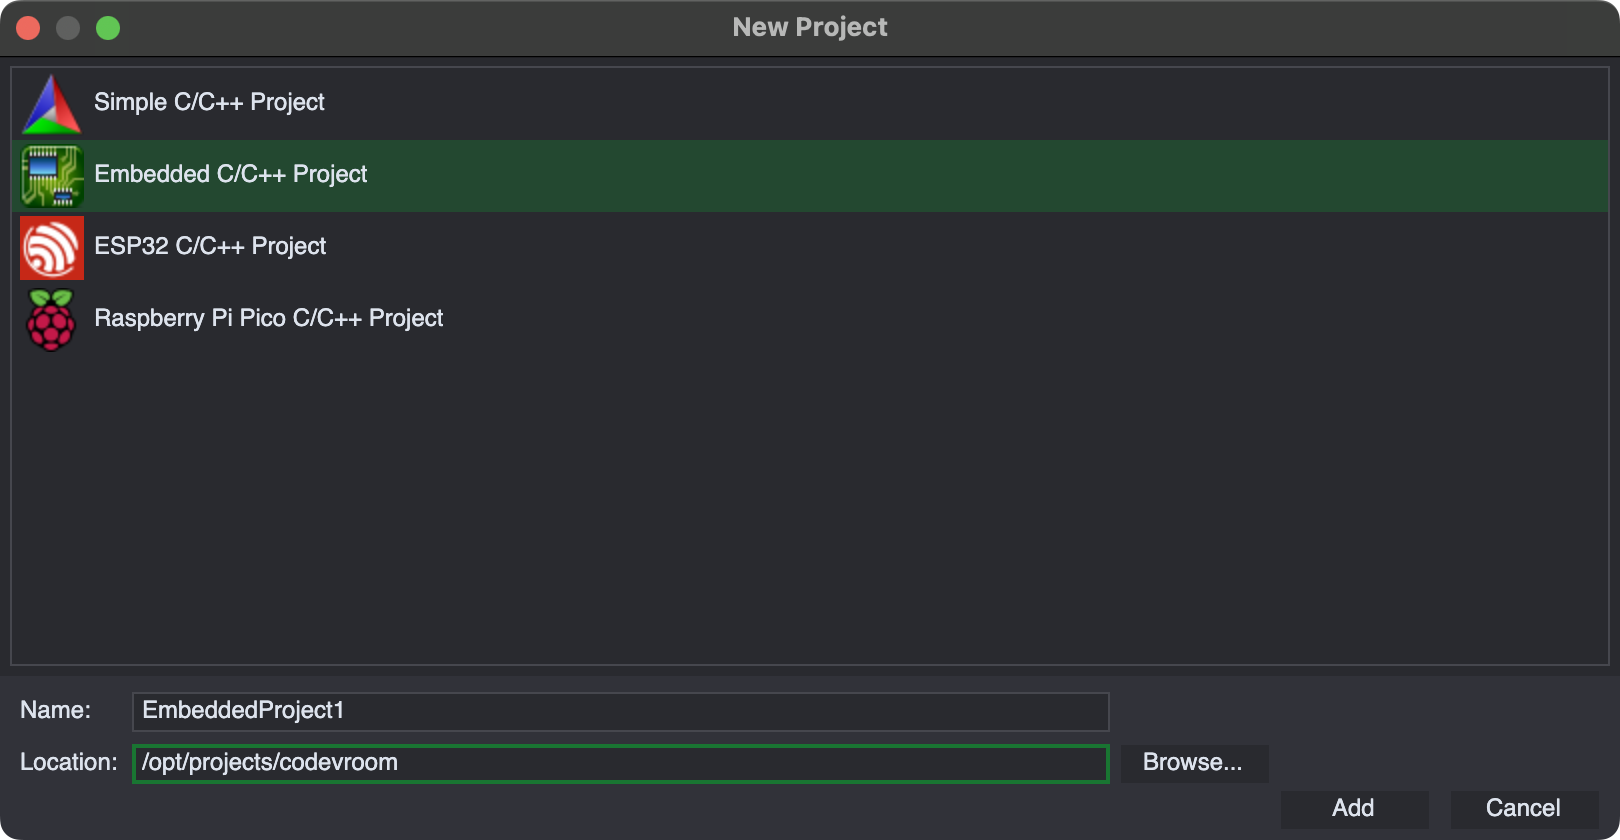
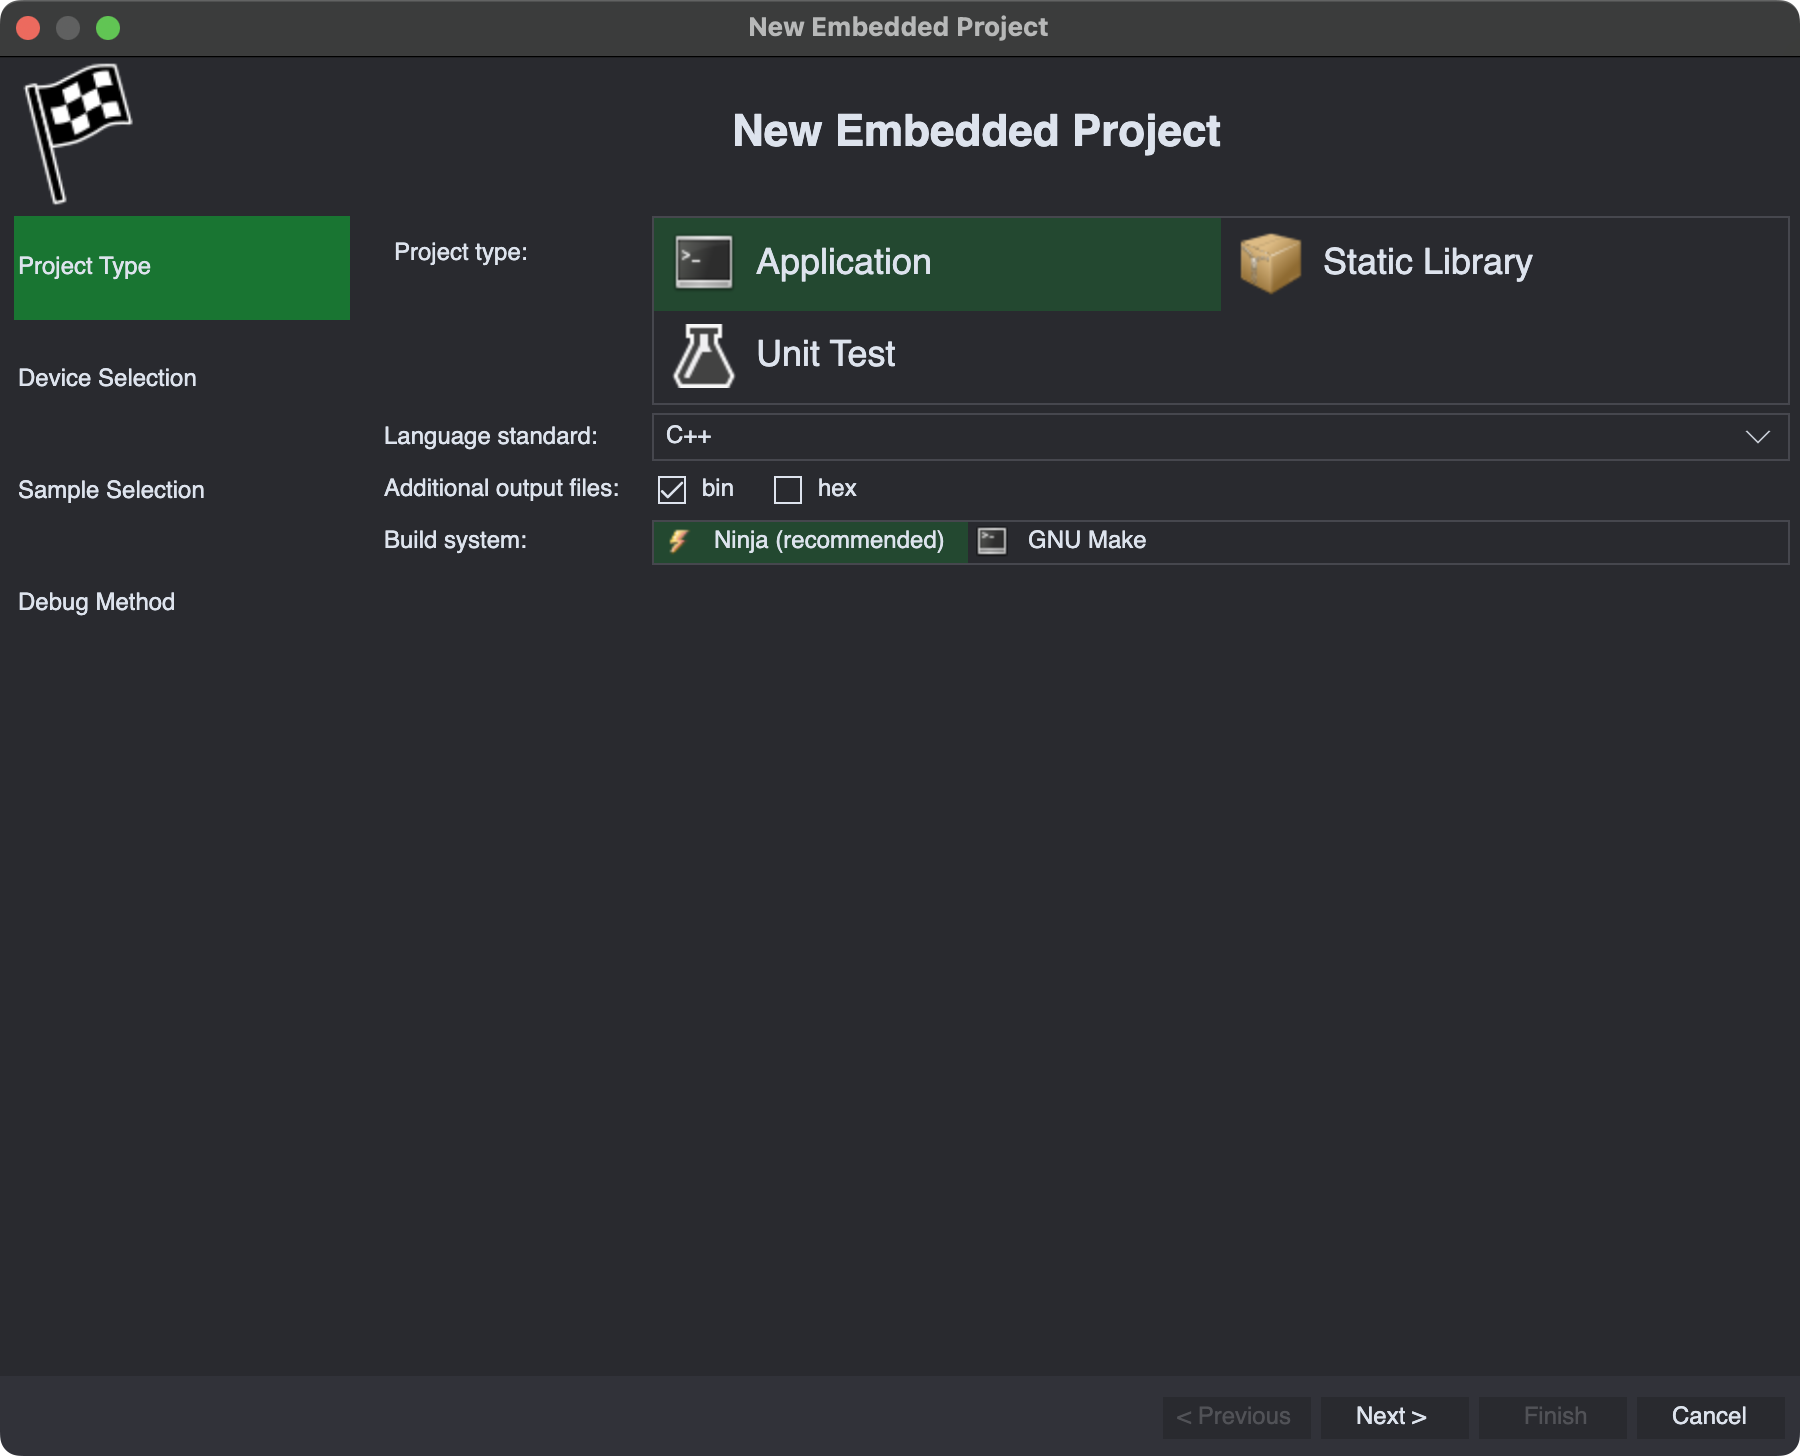
- Proceed with the default settings on the first page:
- The next page allows selecting a toolchain. As of v0.6, only the embedded ARM toolchain from Homebrew is supported. Select it and choose the device you would like to target:
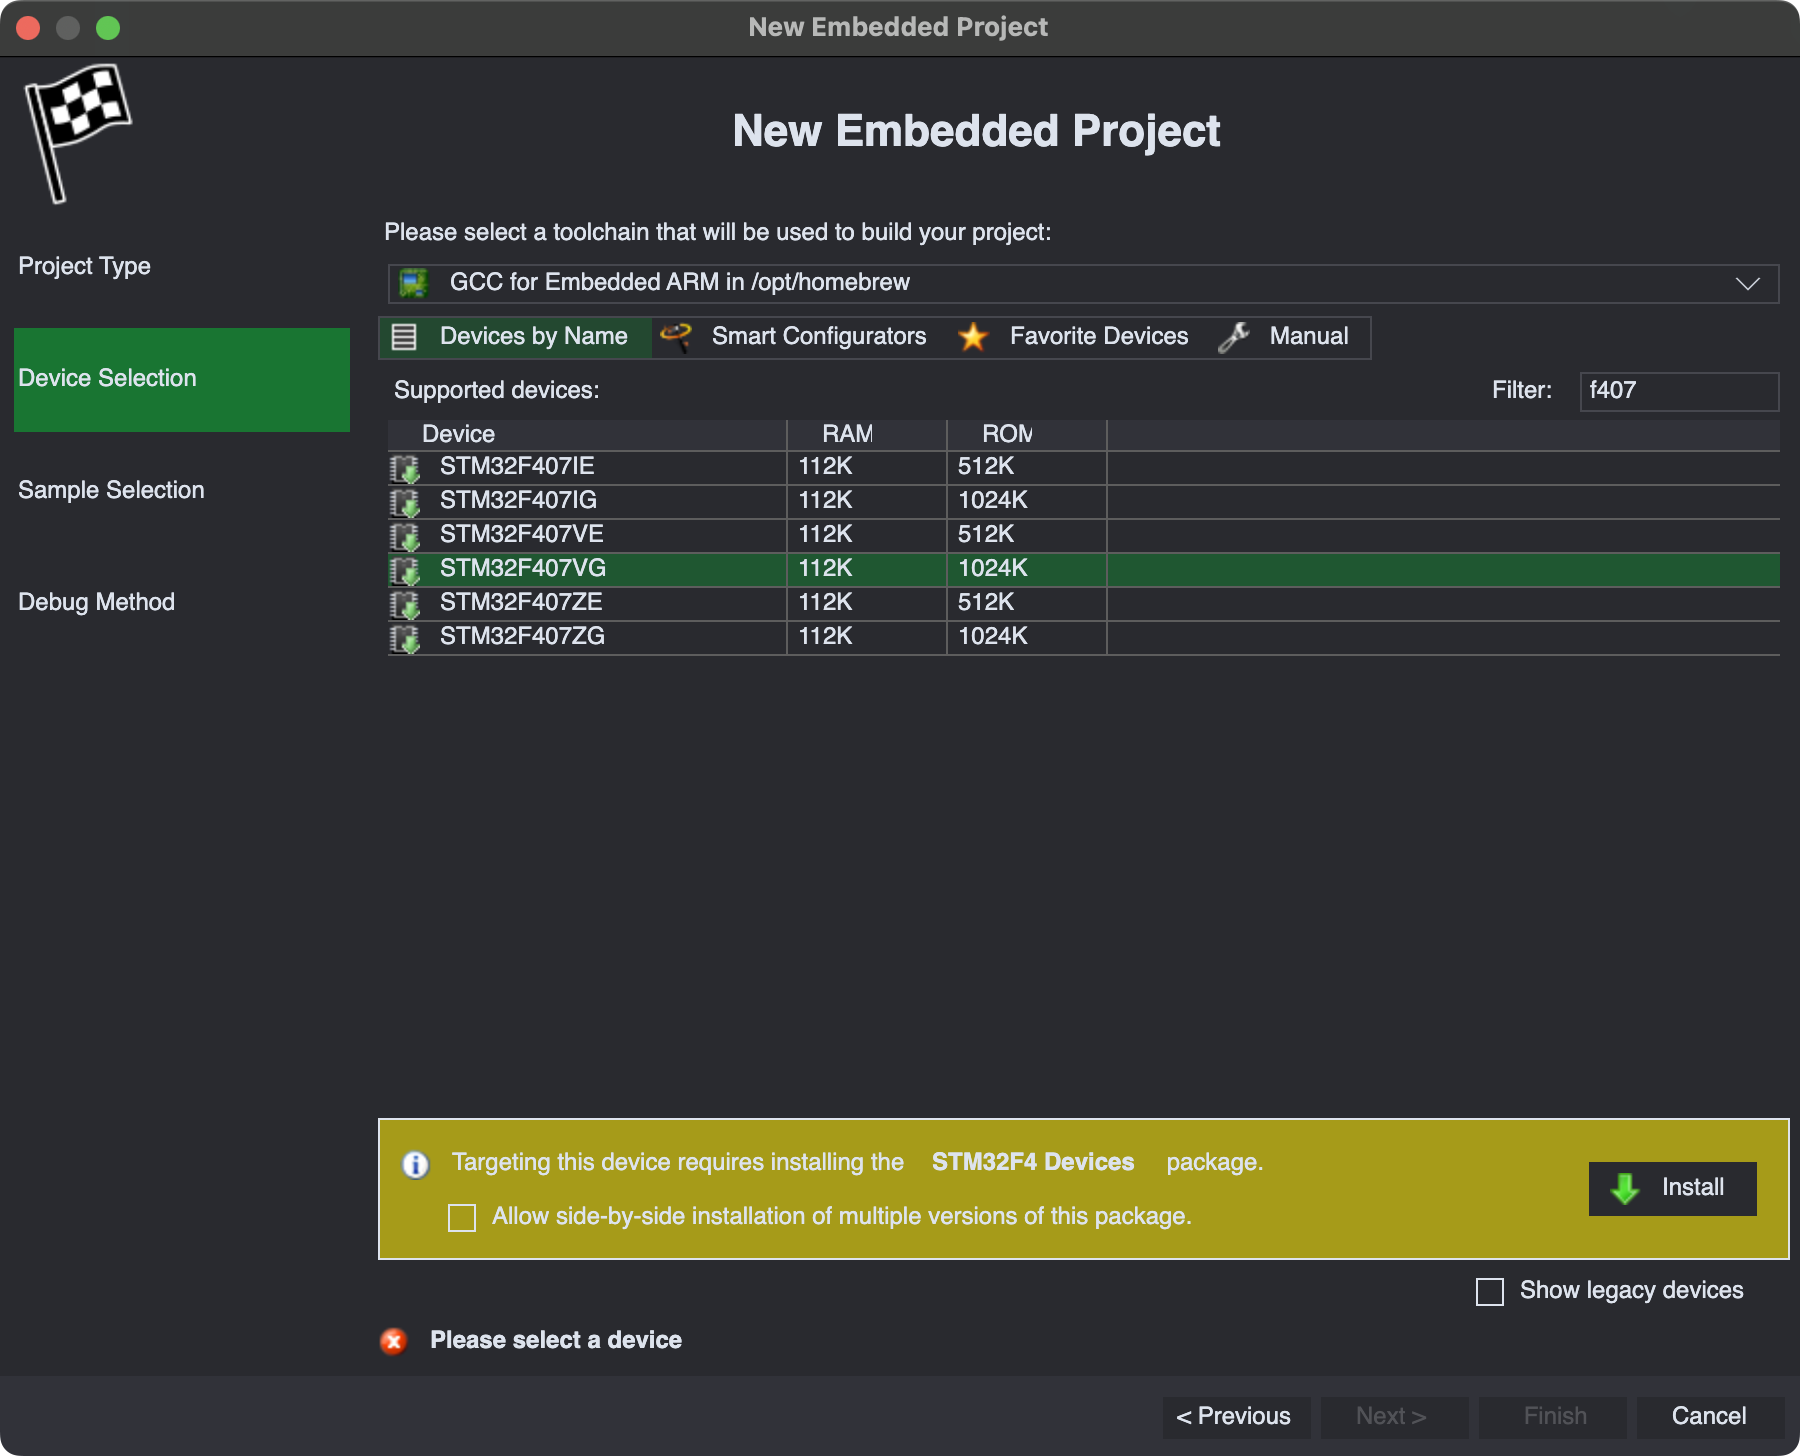
- Press the “download” button to get the device support package. Once it gets downloaded and installed, CodeVROOM will show the configuration settings for the device:
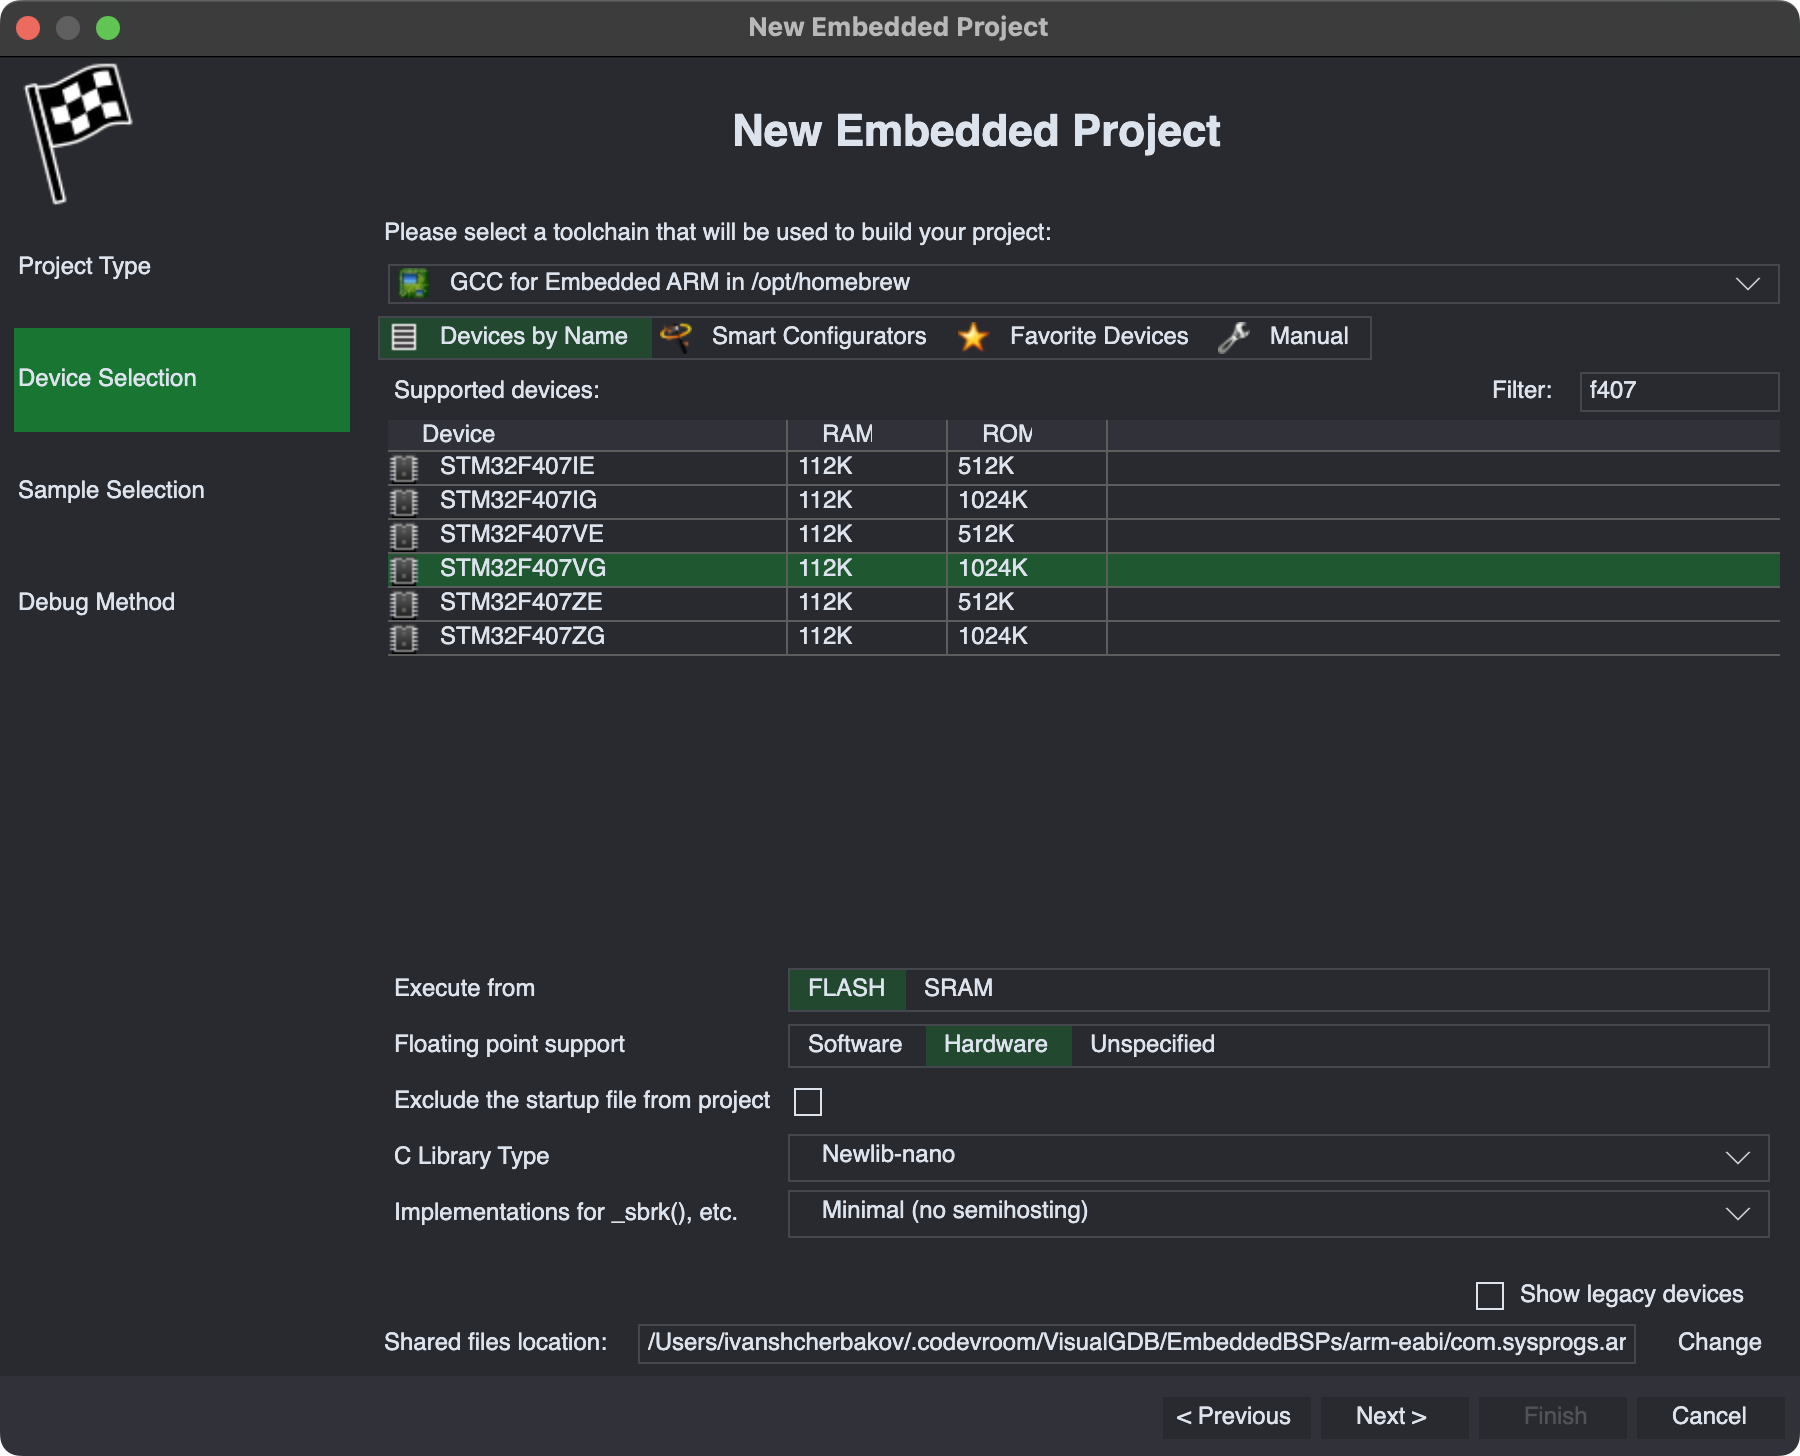
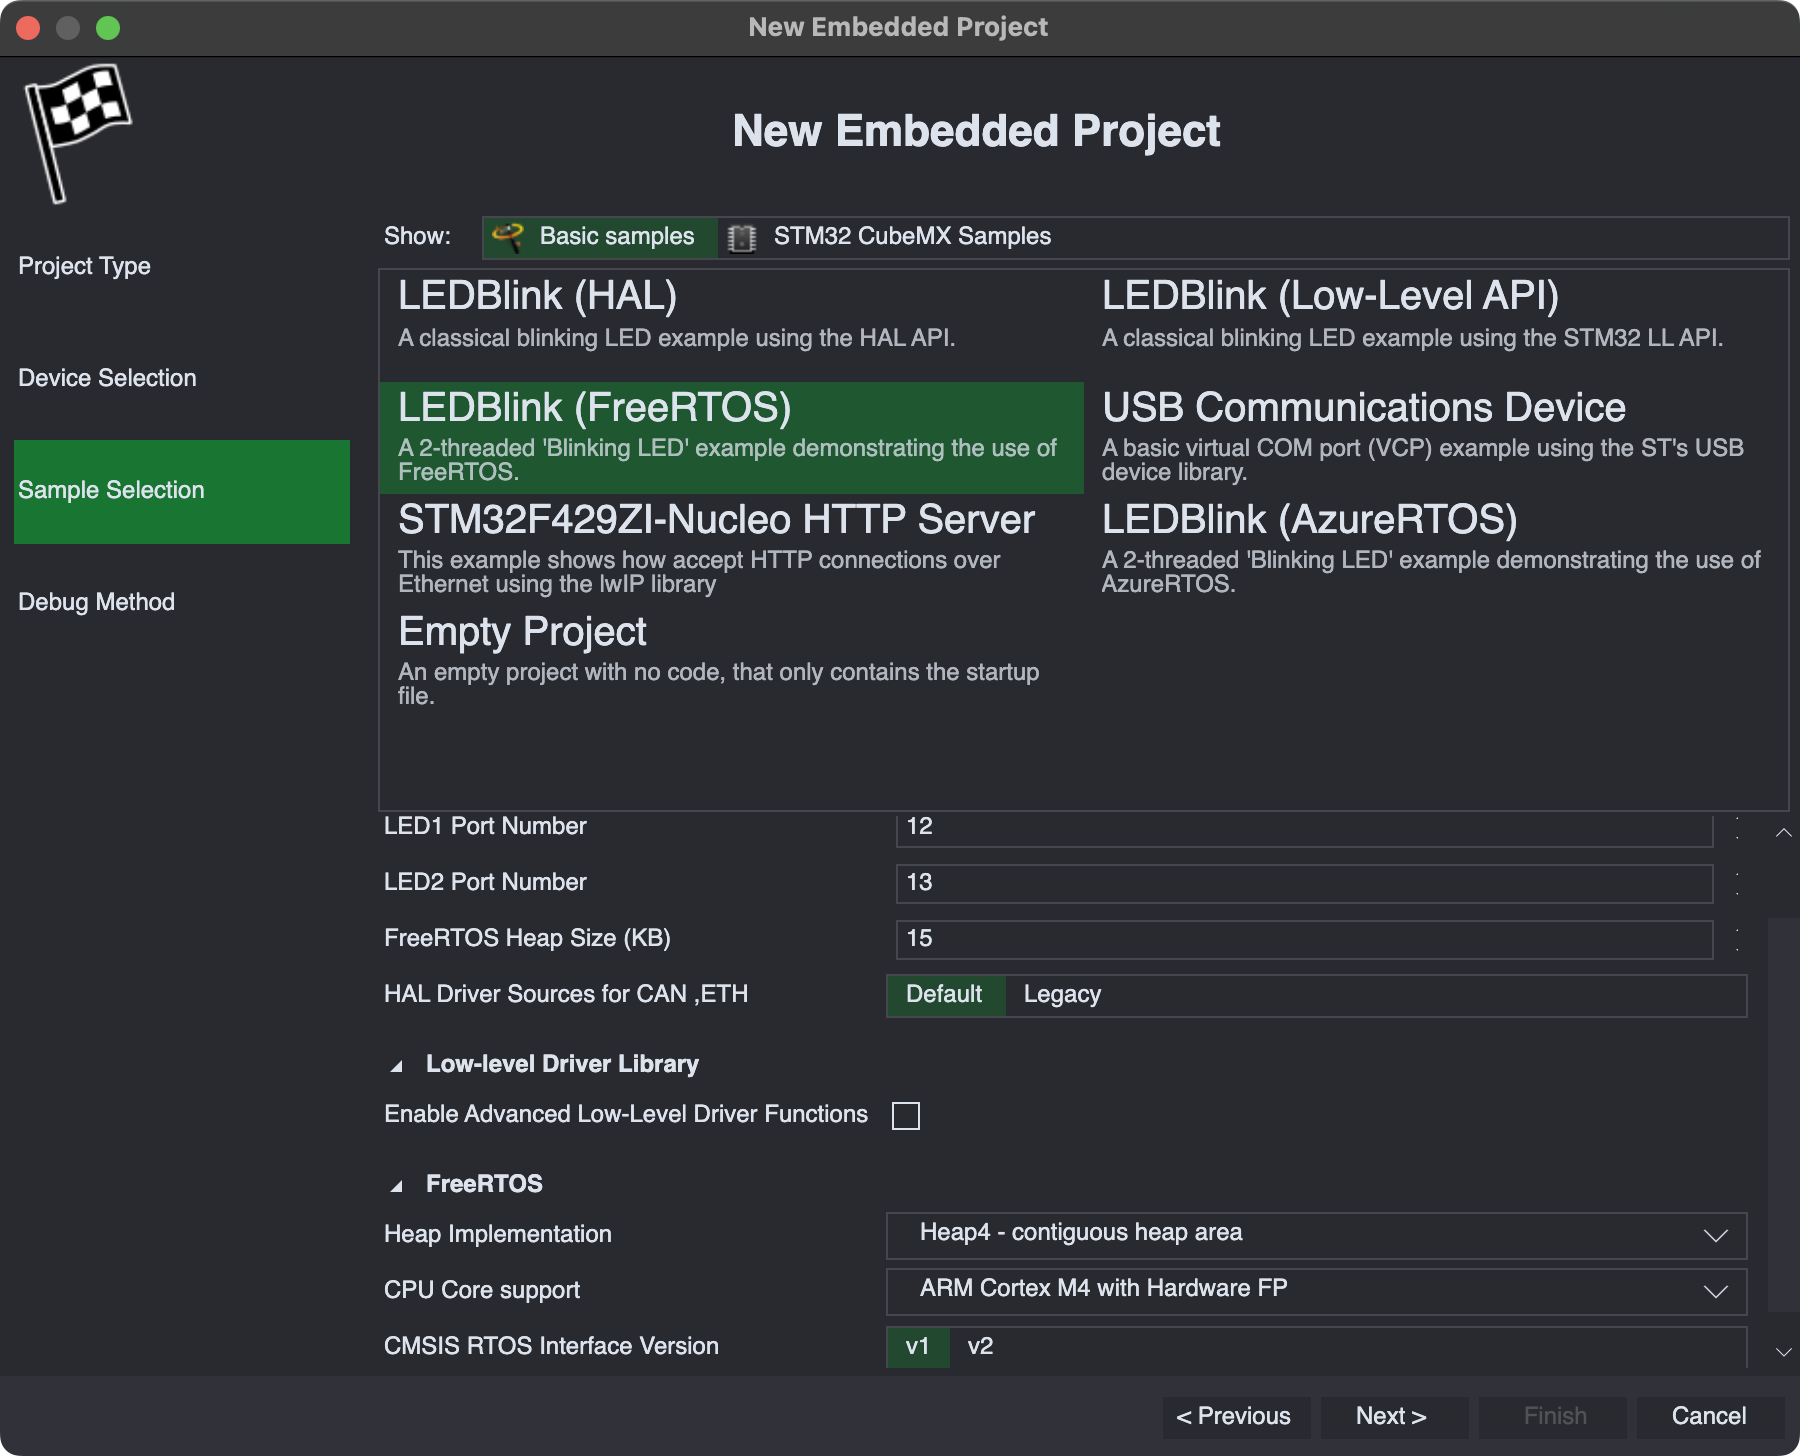
- Proceed with the default settings and go to the next page. Select the “LEDBlink (FreeRTOS)” sample:
- Make sure you have OpenOCD installed. Then, select it from the list and pick your debug interface script:
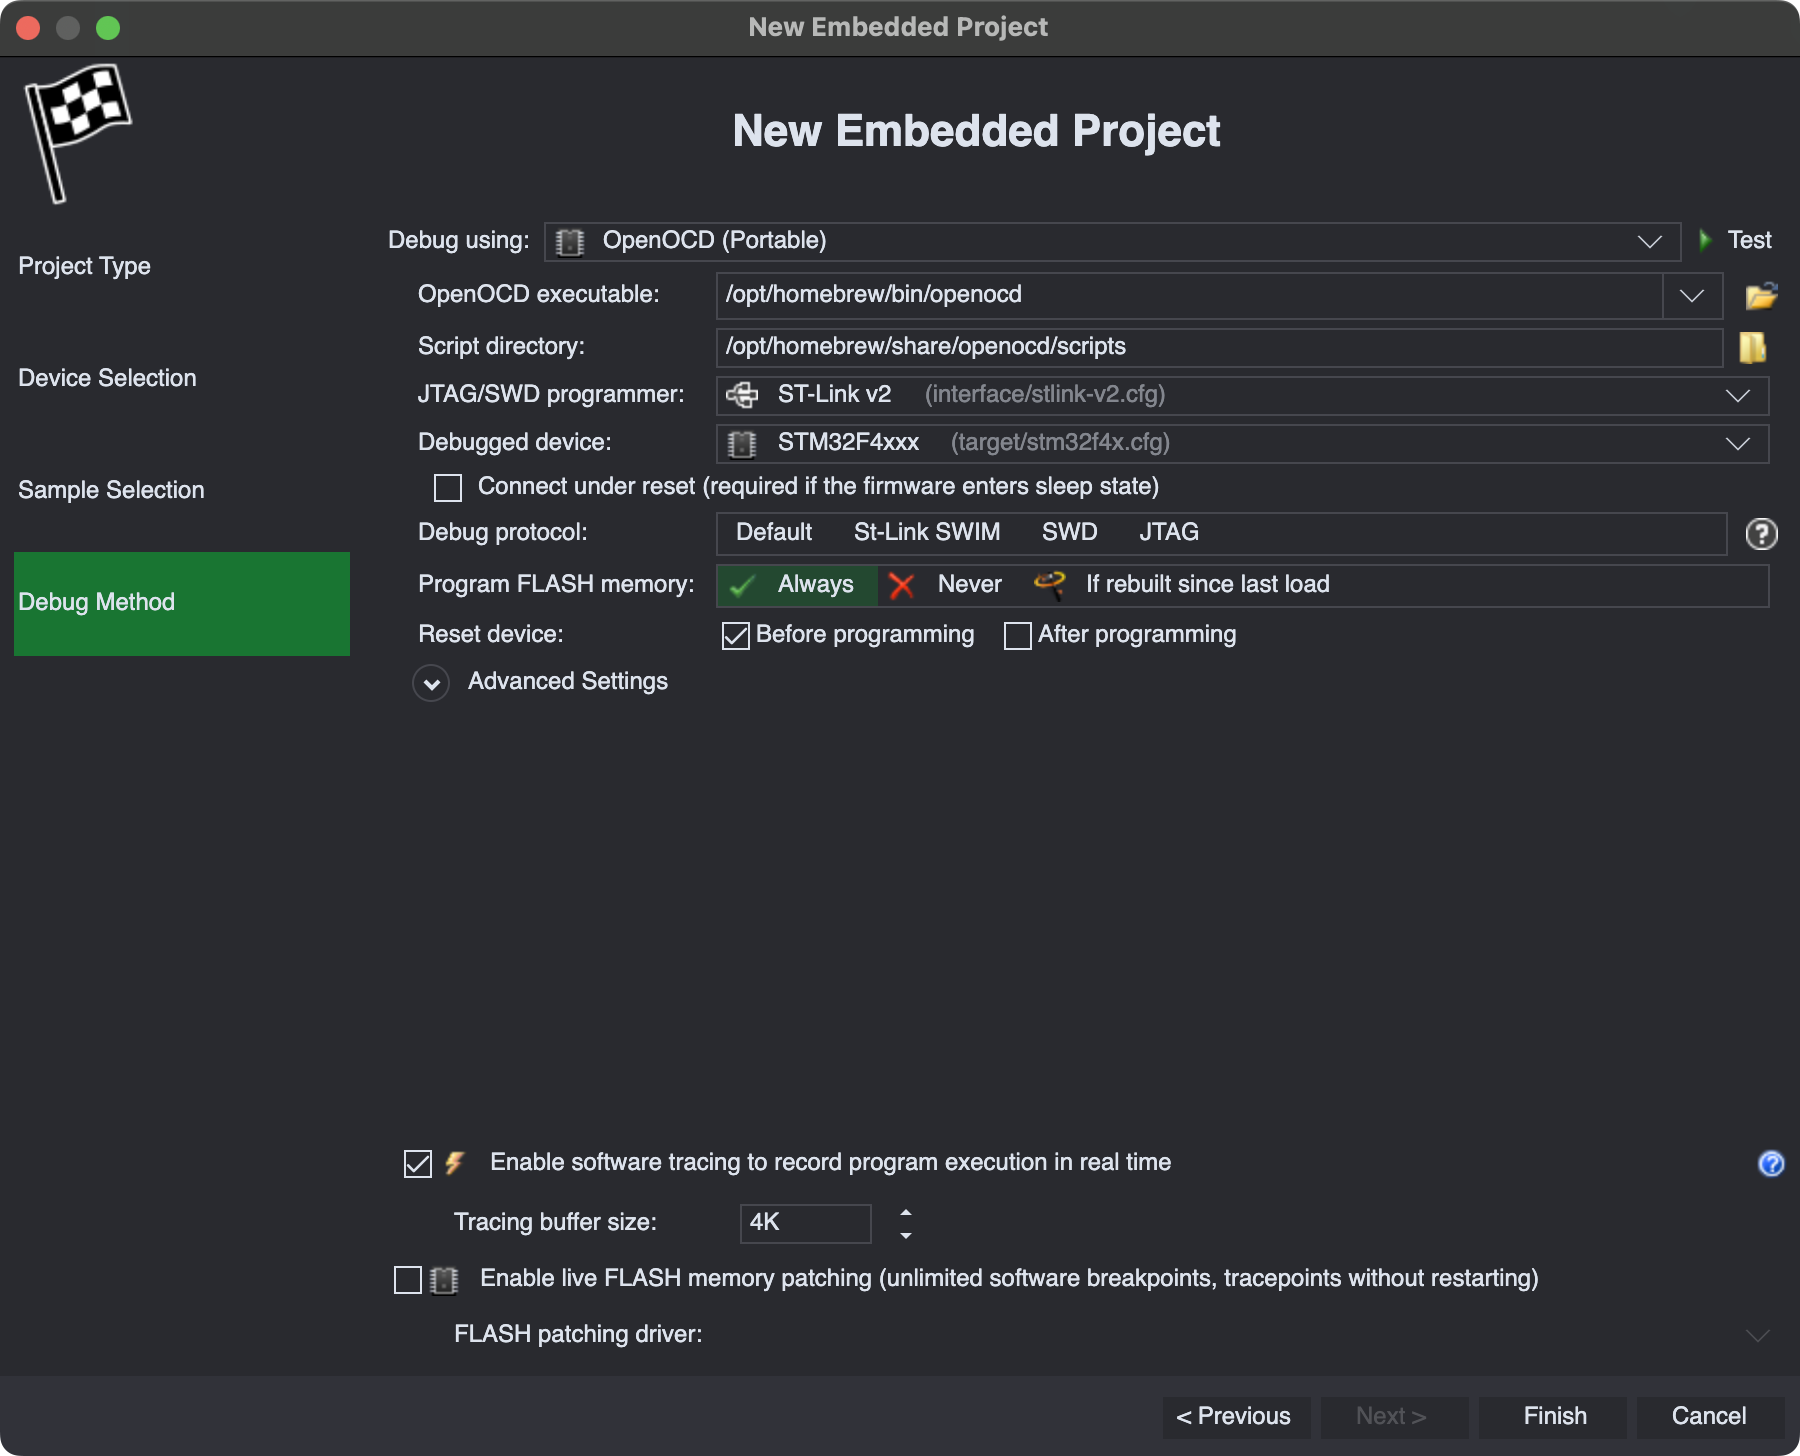
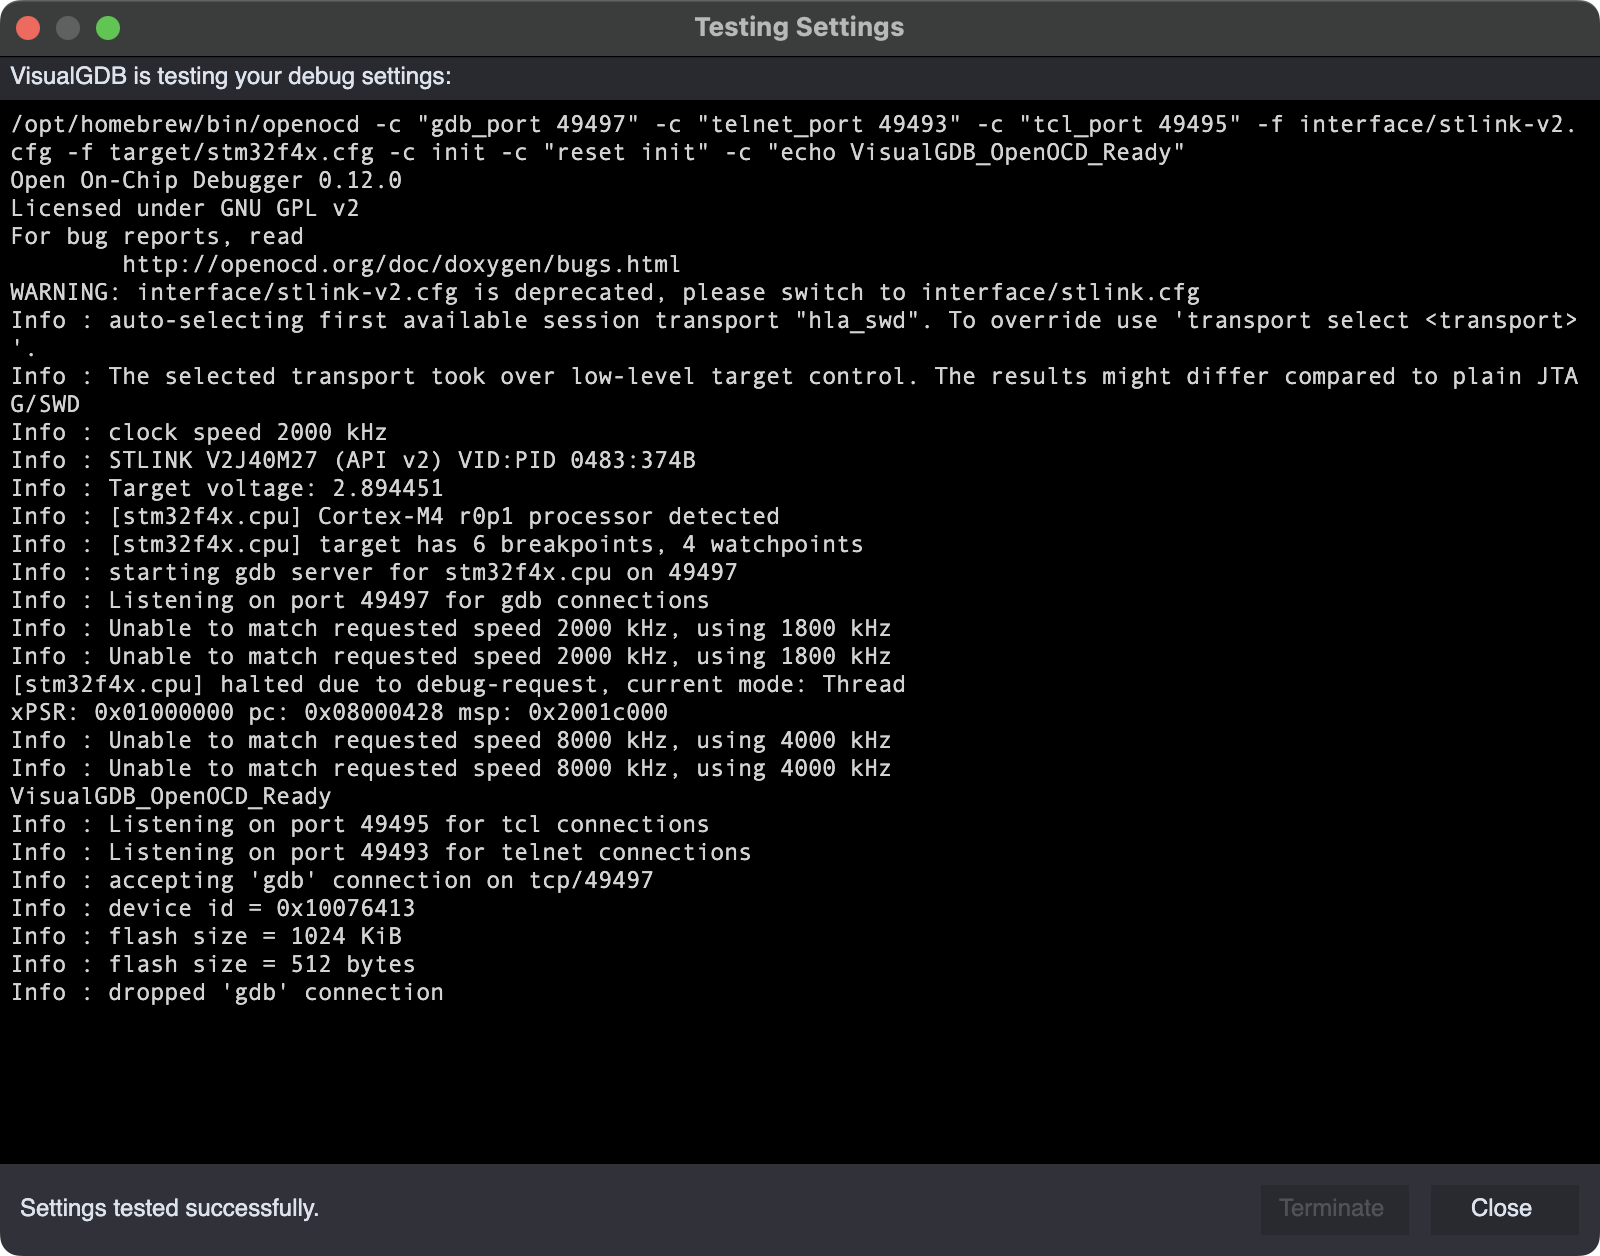
- Press”Test” to automatically validate that the debug settings work:
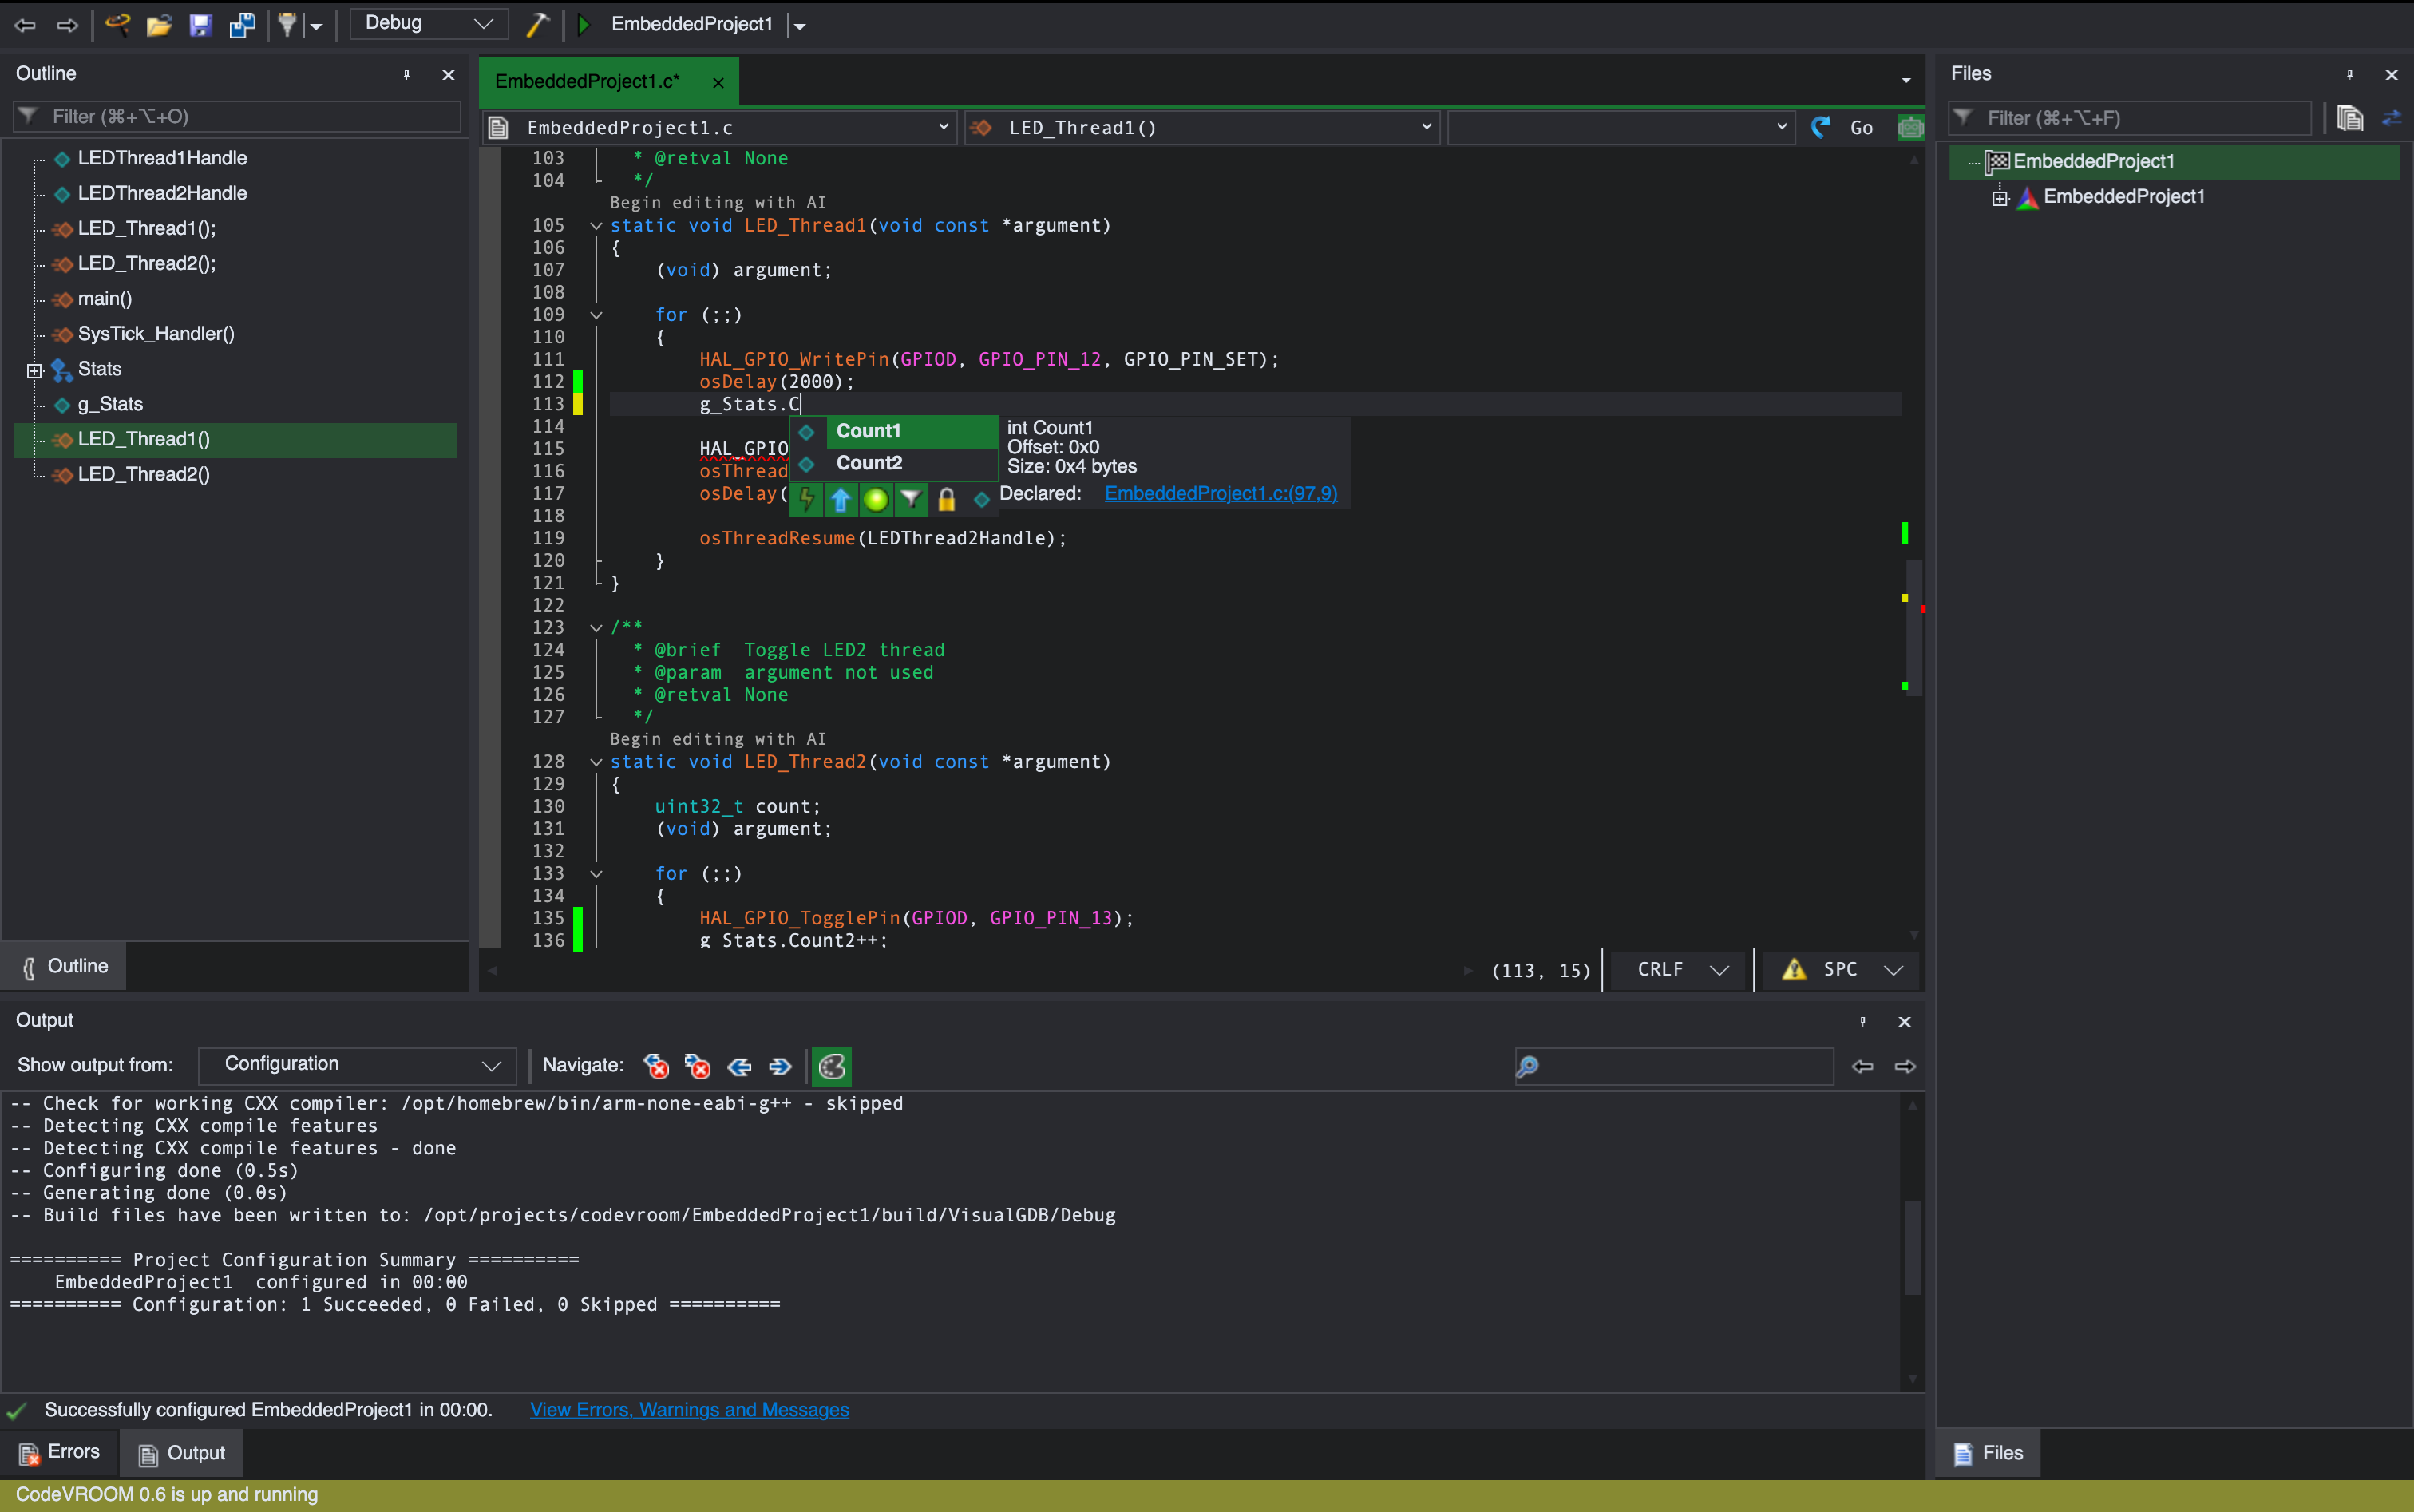
- Press “Finish” to create the project.Add a g_Stats structure with 2 int fields and update both thread to increment one field each:
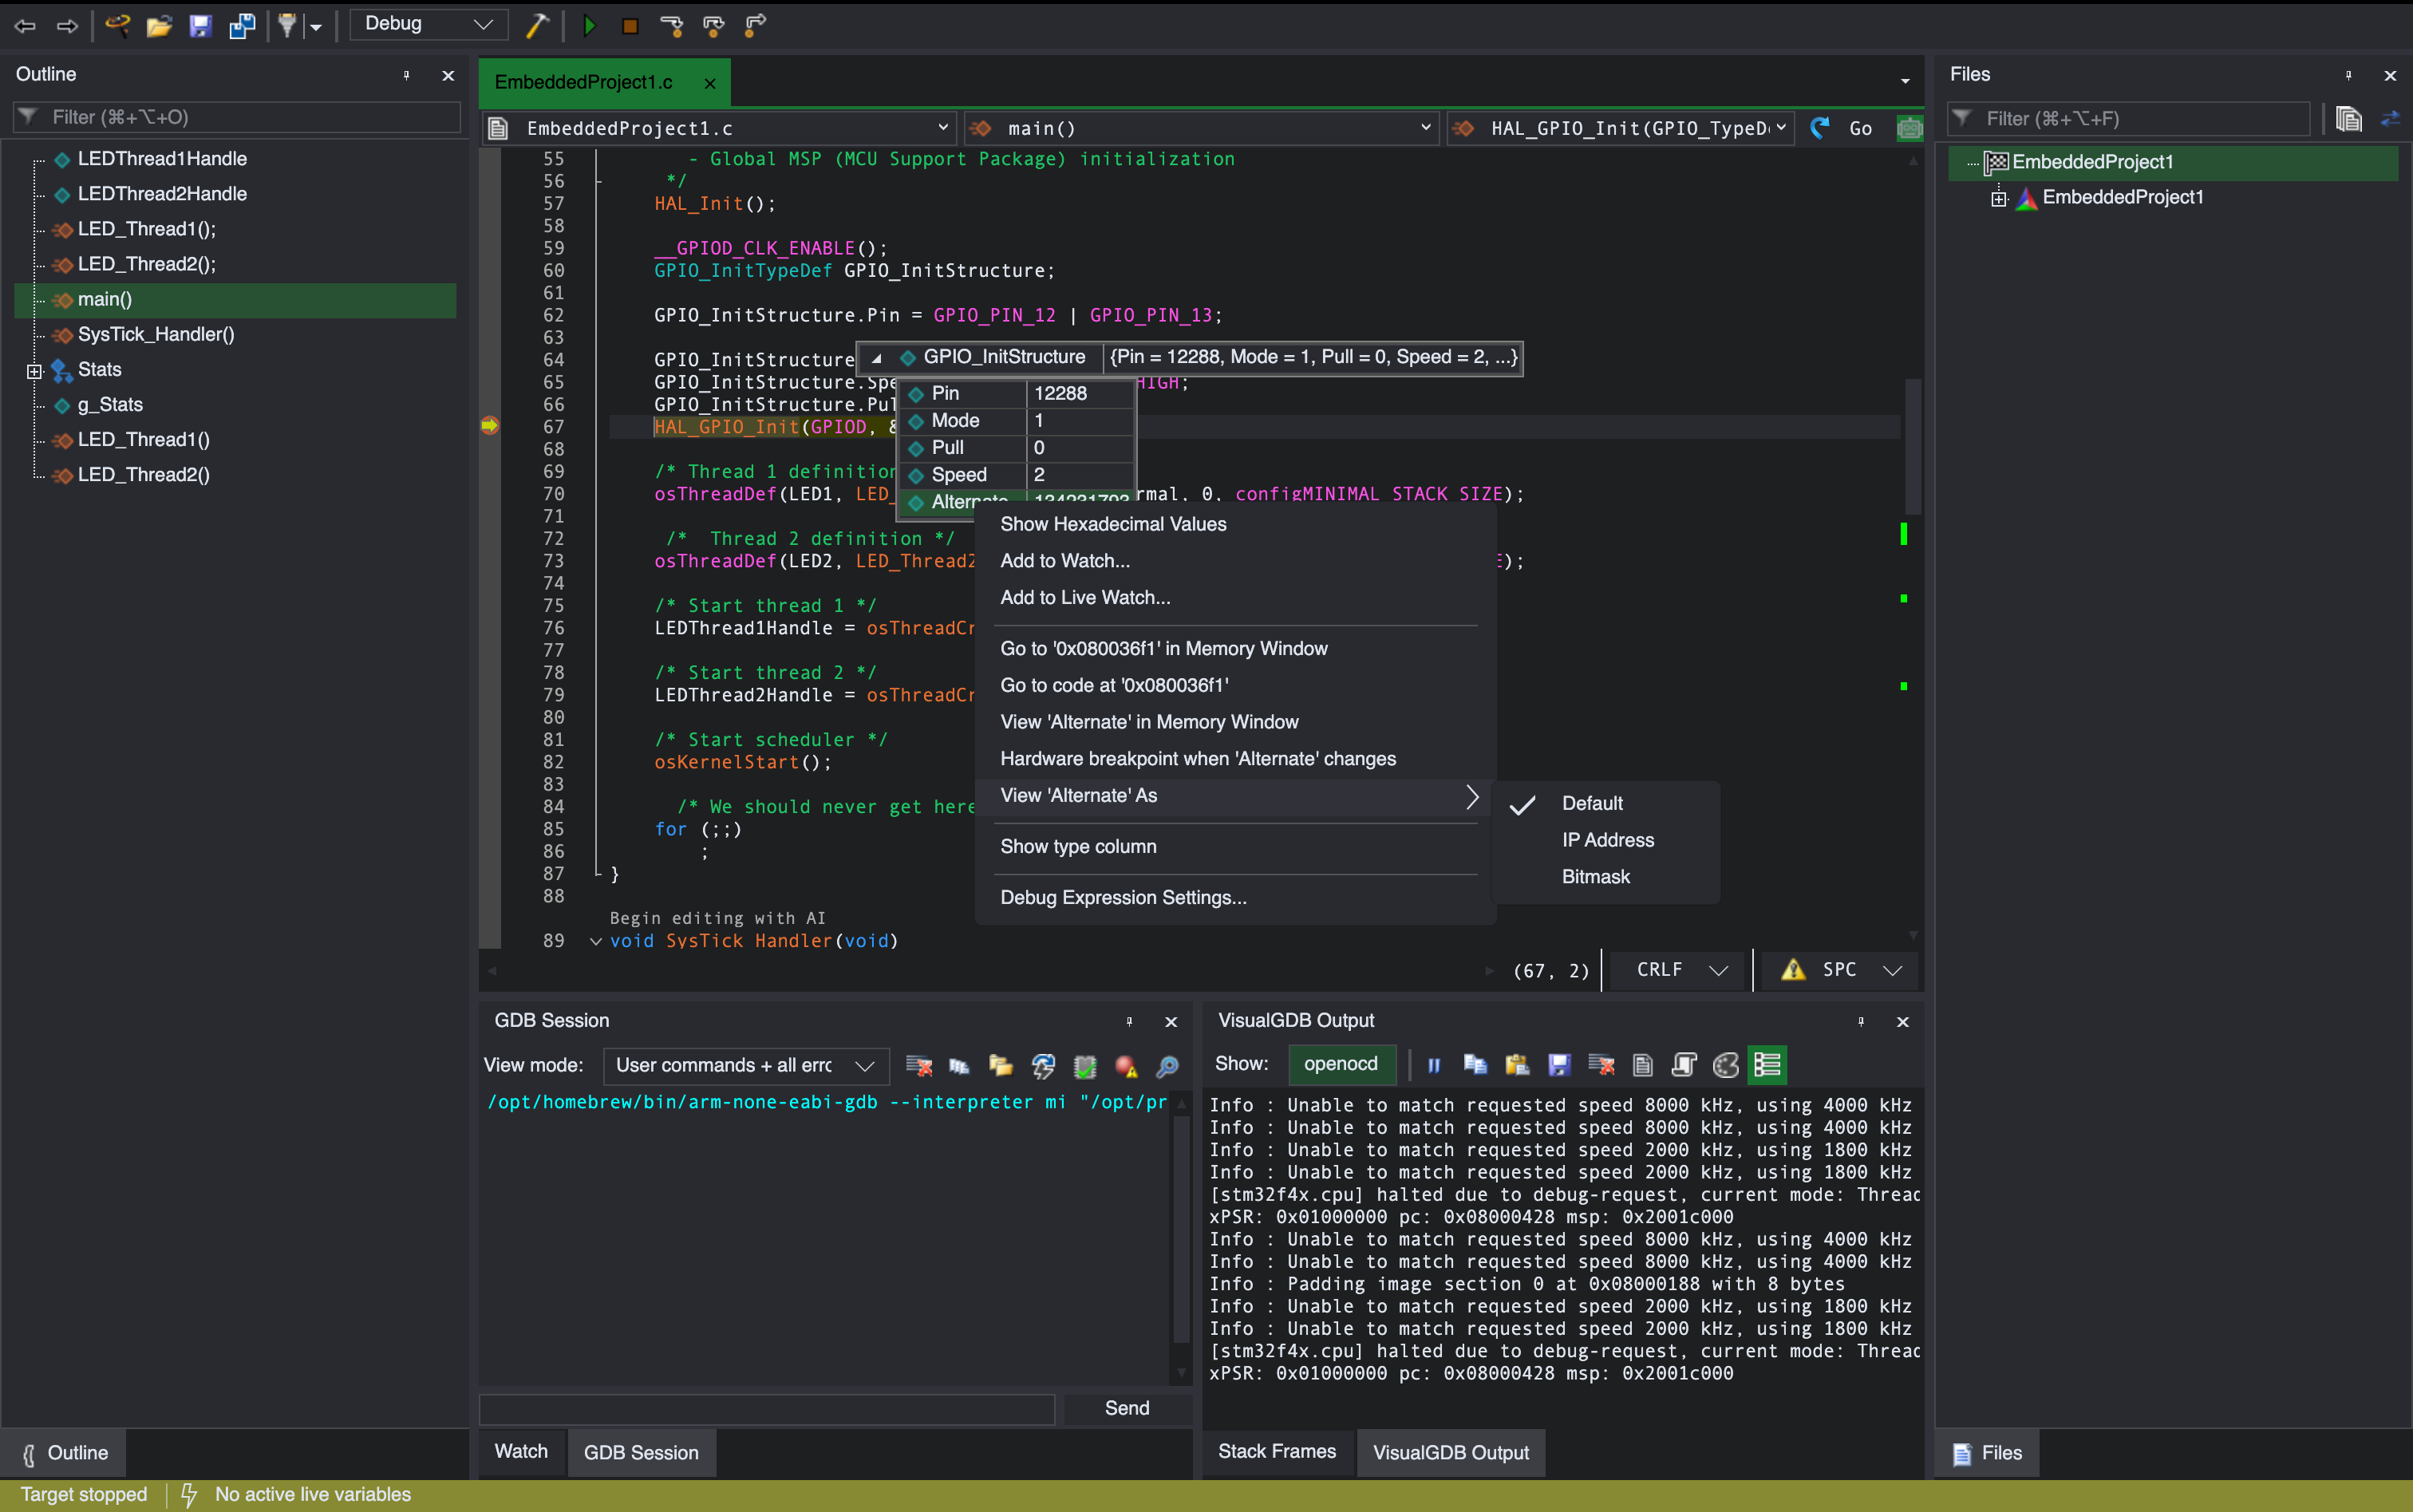
- Set a breakpoint on the call to HAL_GPIO_Init() and start debugging. Once the breakpoint triggers, hover the mouse over GPIO_InitStructure. You can use the context menu to quickly access various auxiliary windows, or customize the appearance of the expressions:
- Resume debugging. Hover the mouse over the global structure with counters. Note how CodeVROOM shows the values in real time without stopping the target:
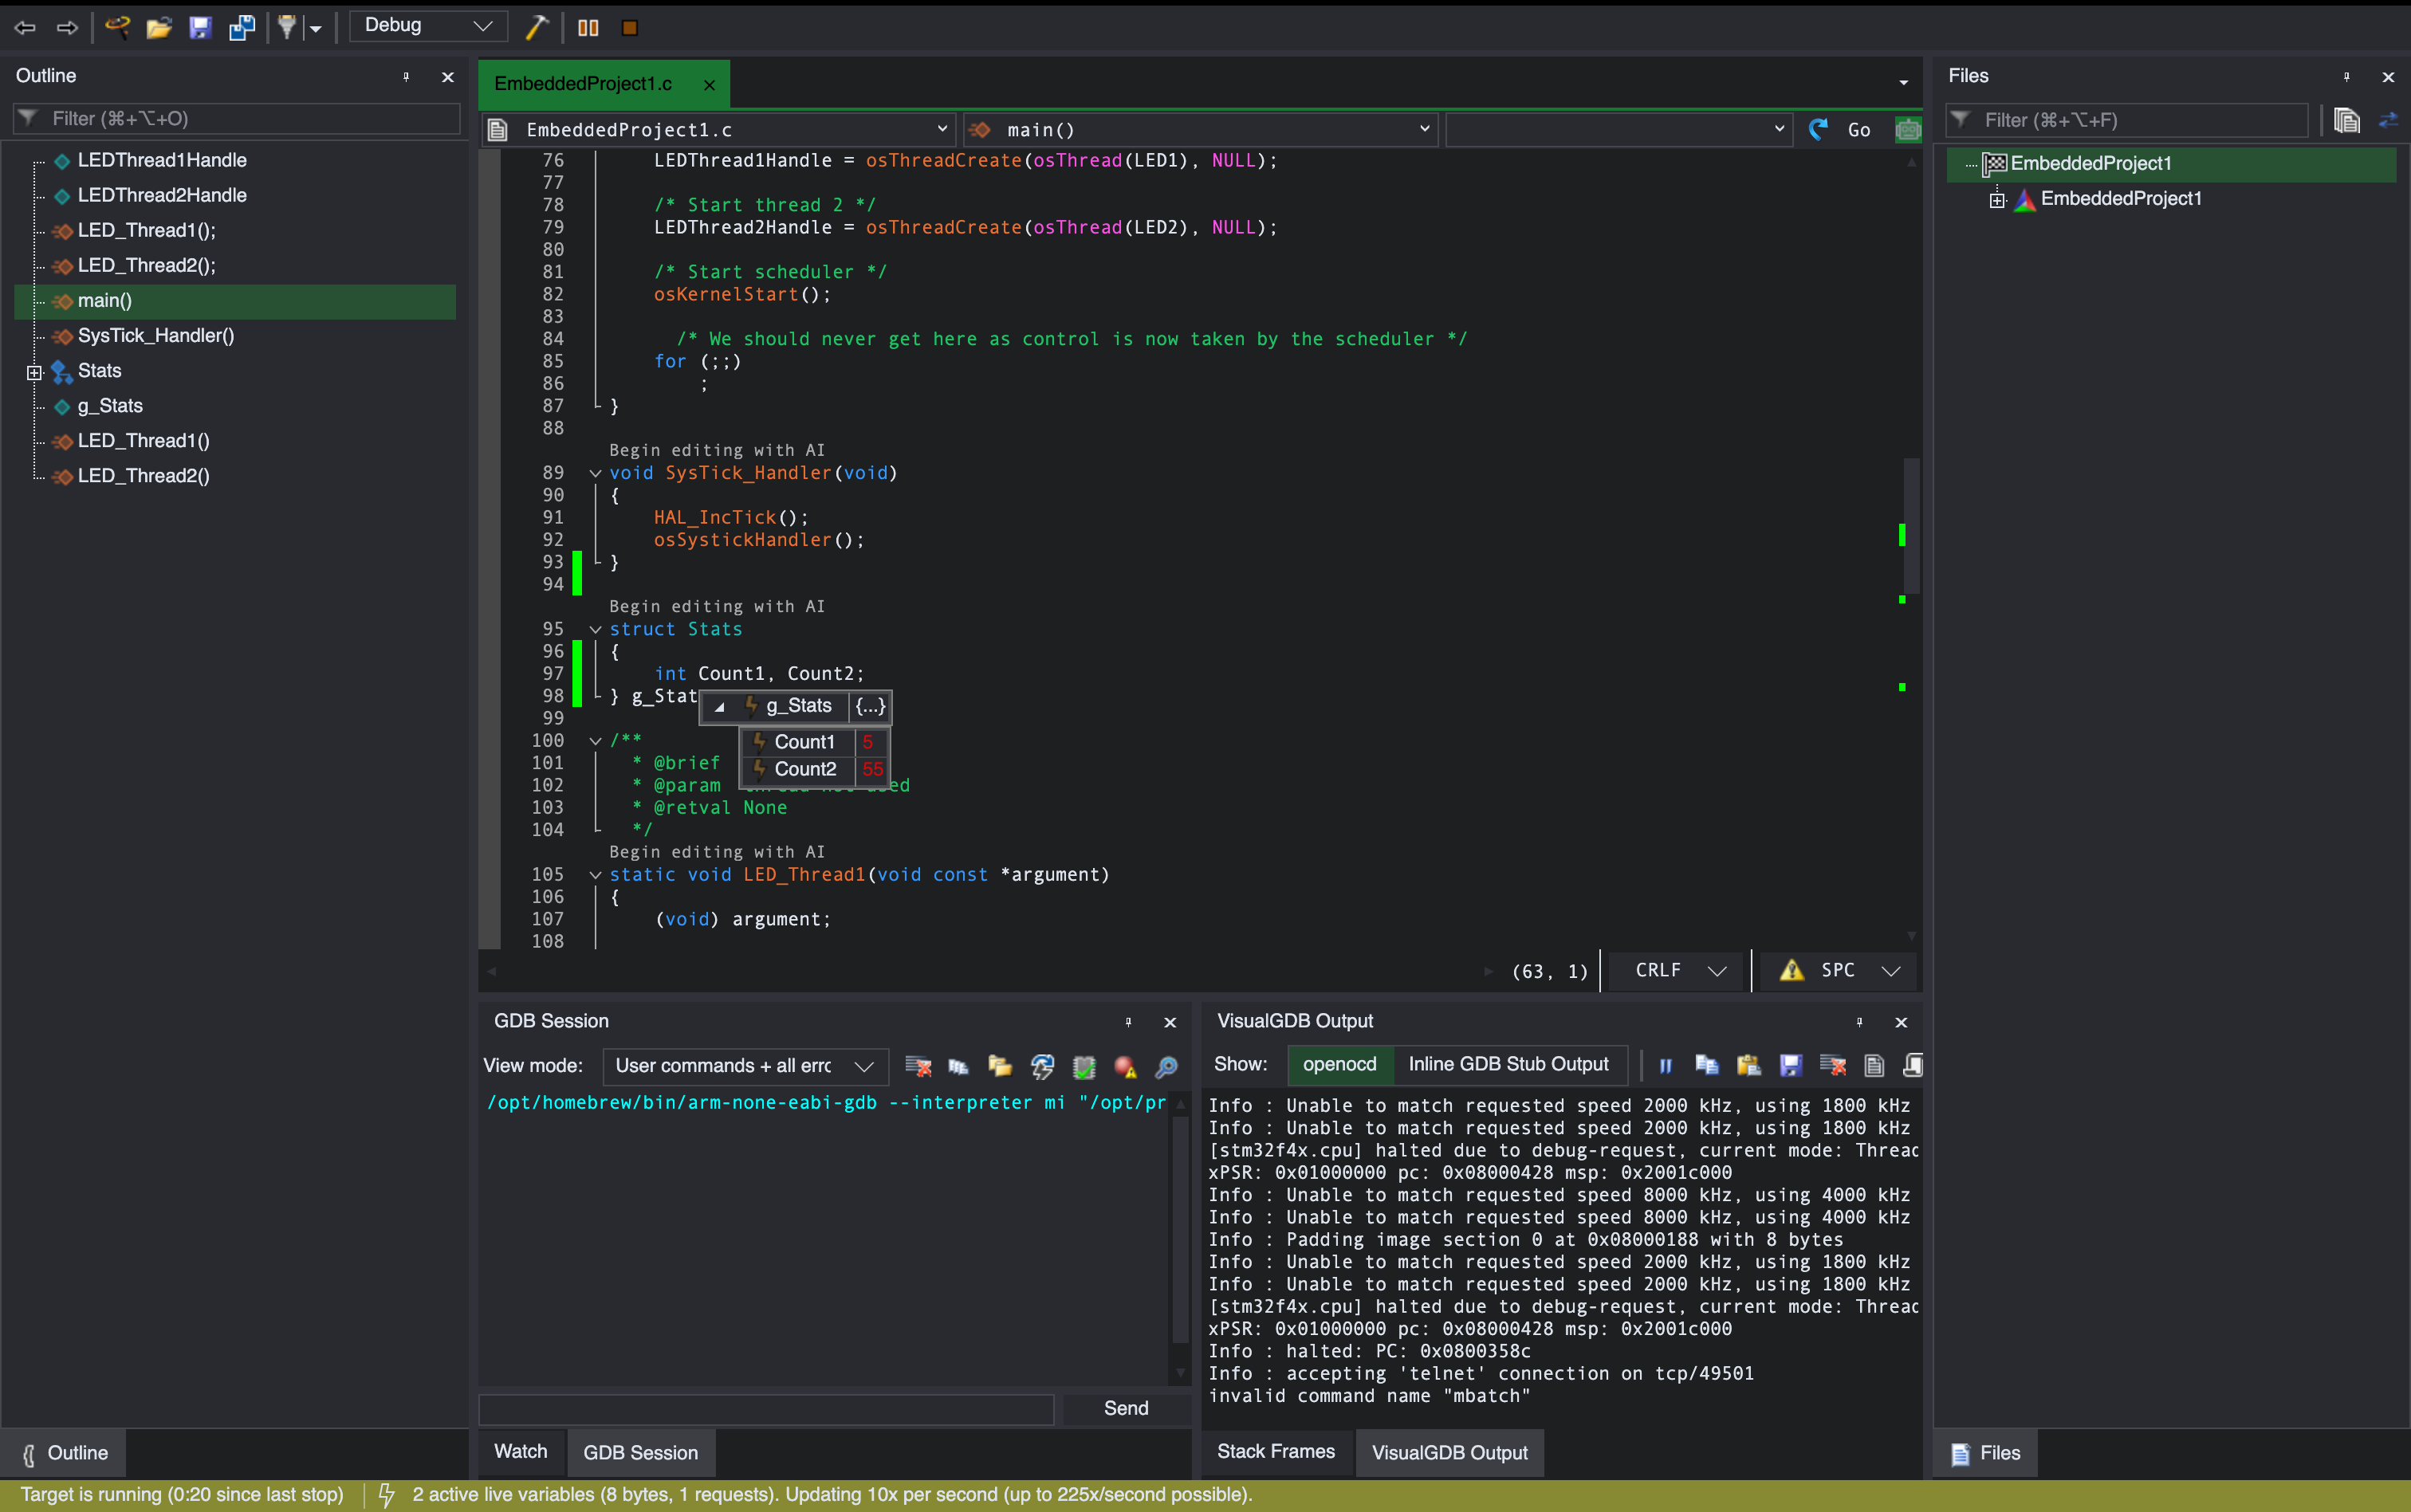 That said, this only works for global variables, that can be located in memory without using GDB. Any complex expressions should be added to the separate Live Watch window where they can be evaluated normally, and then monitorred.
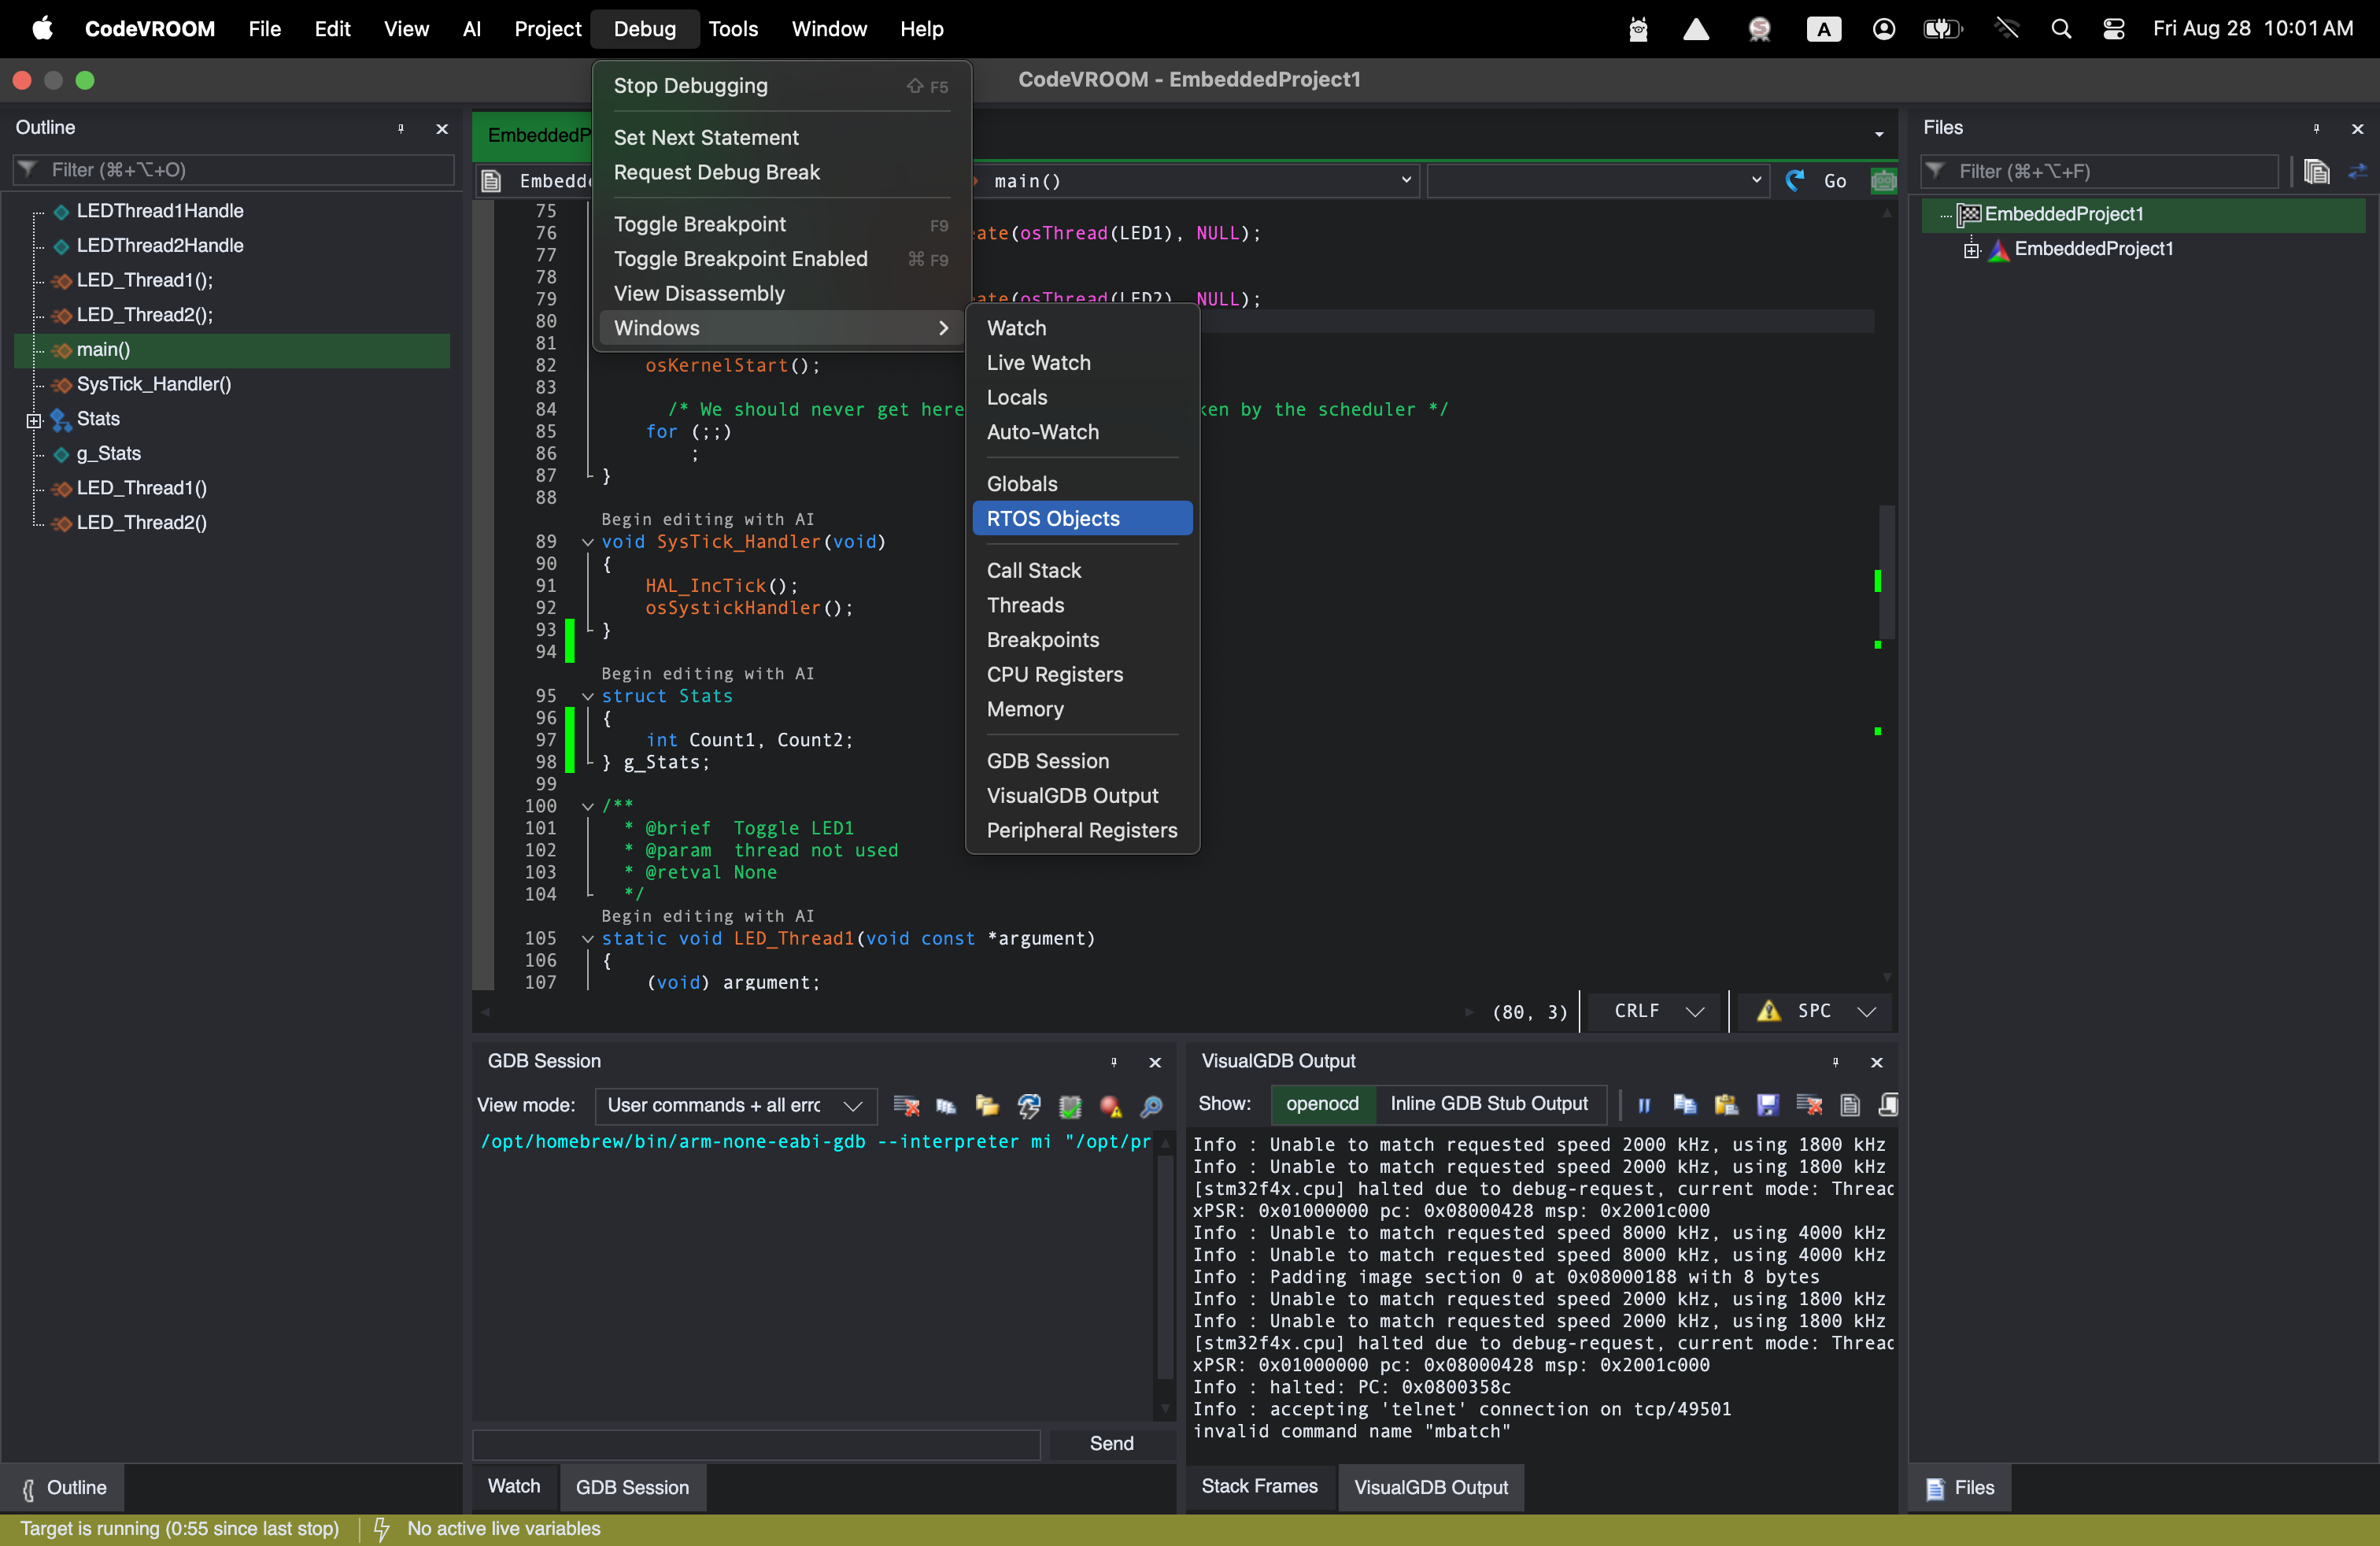
 - Use the Debug->Windows menu to see the tool windows supported by CodeVROOM:
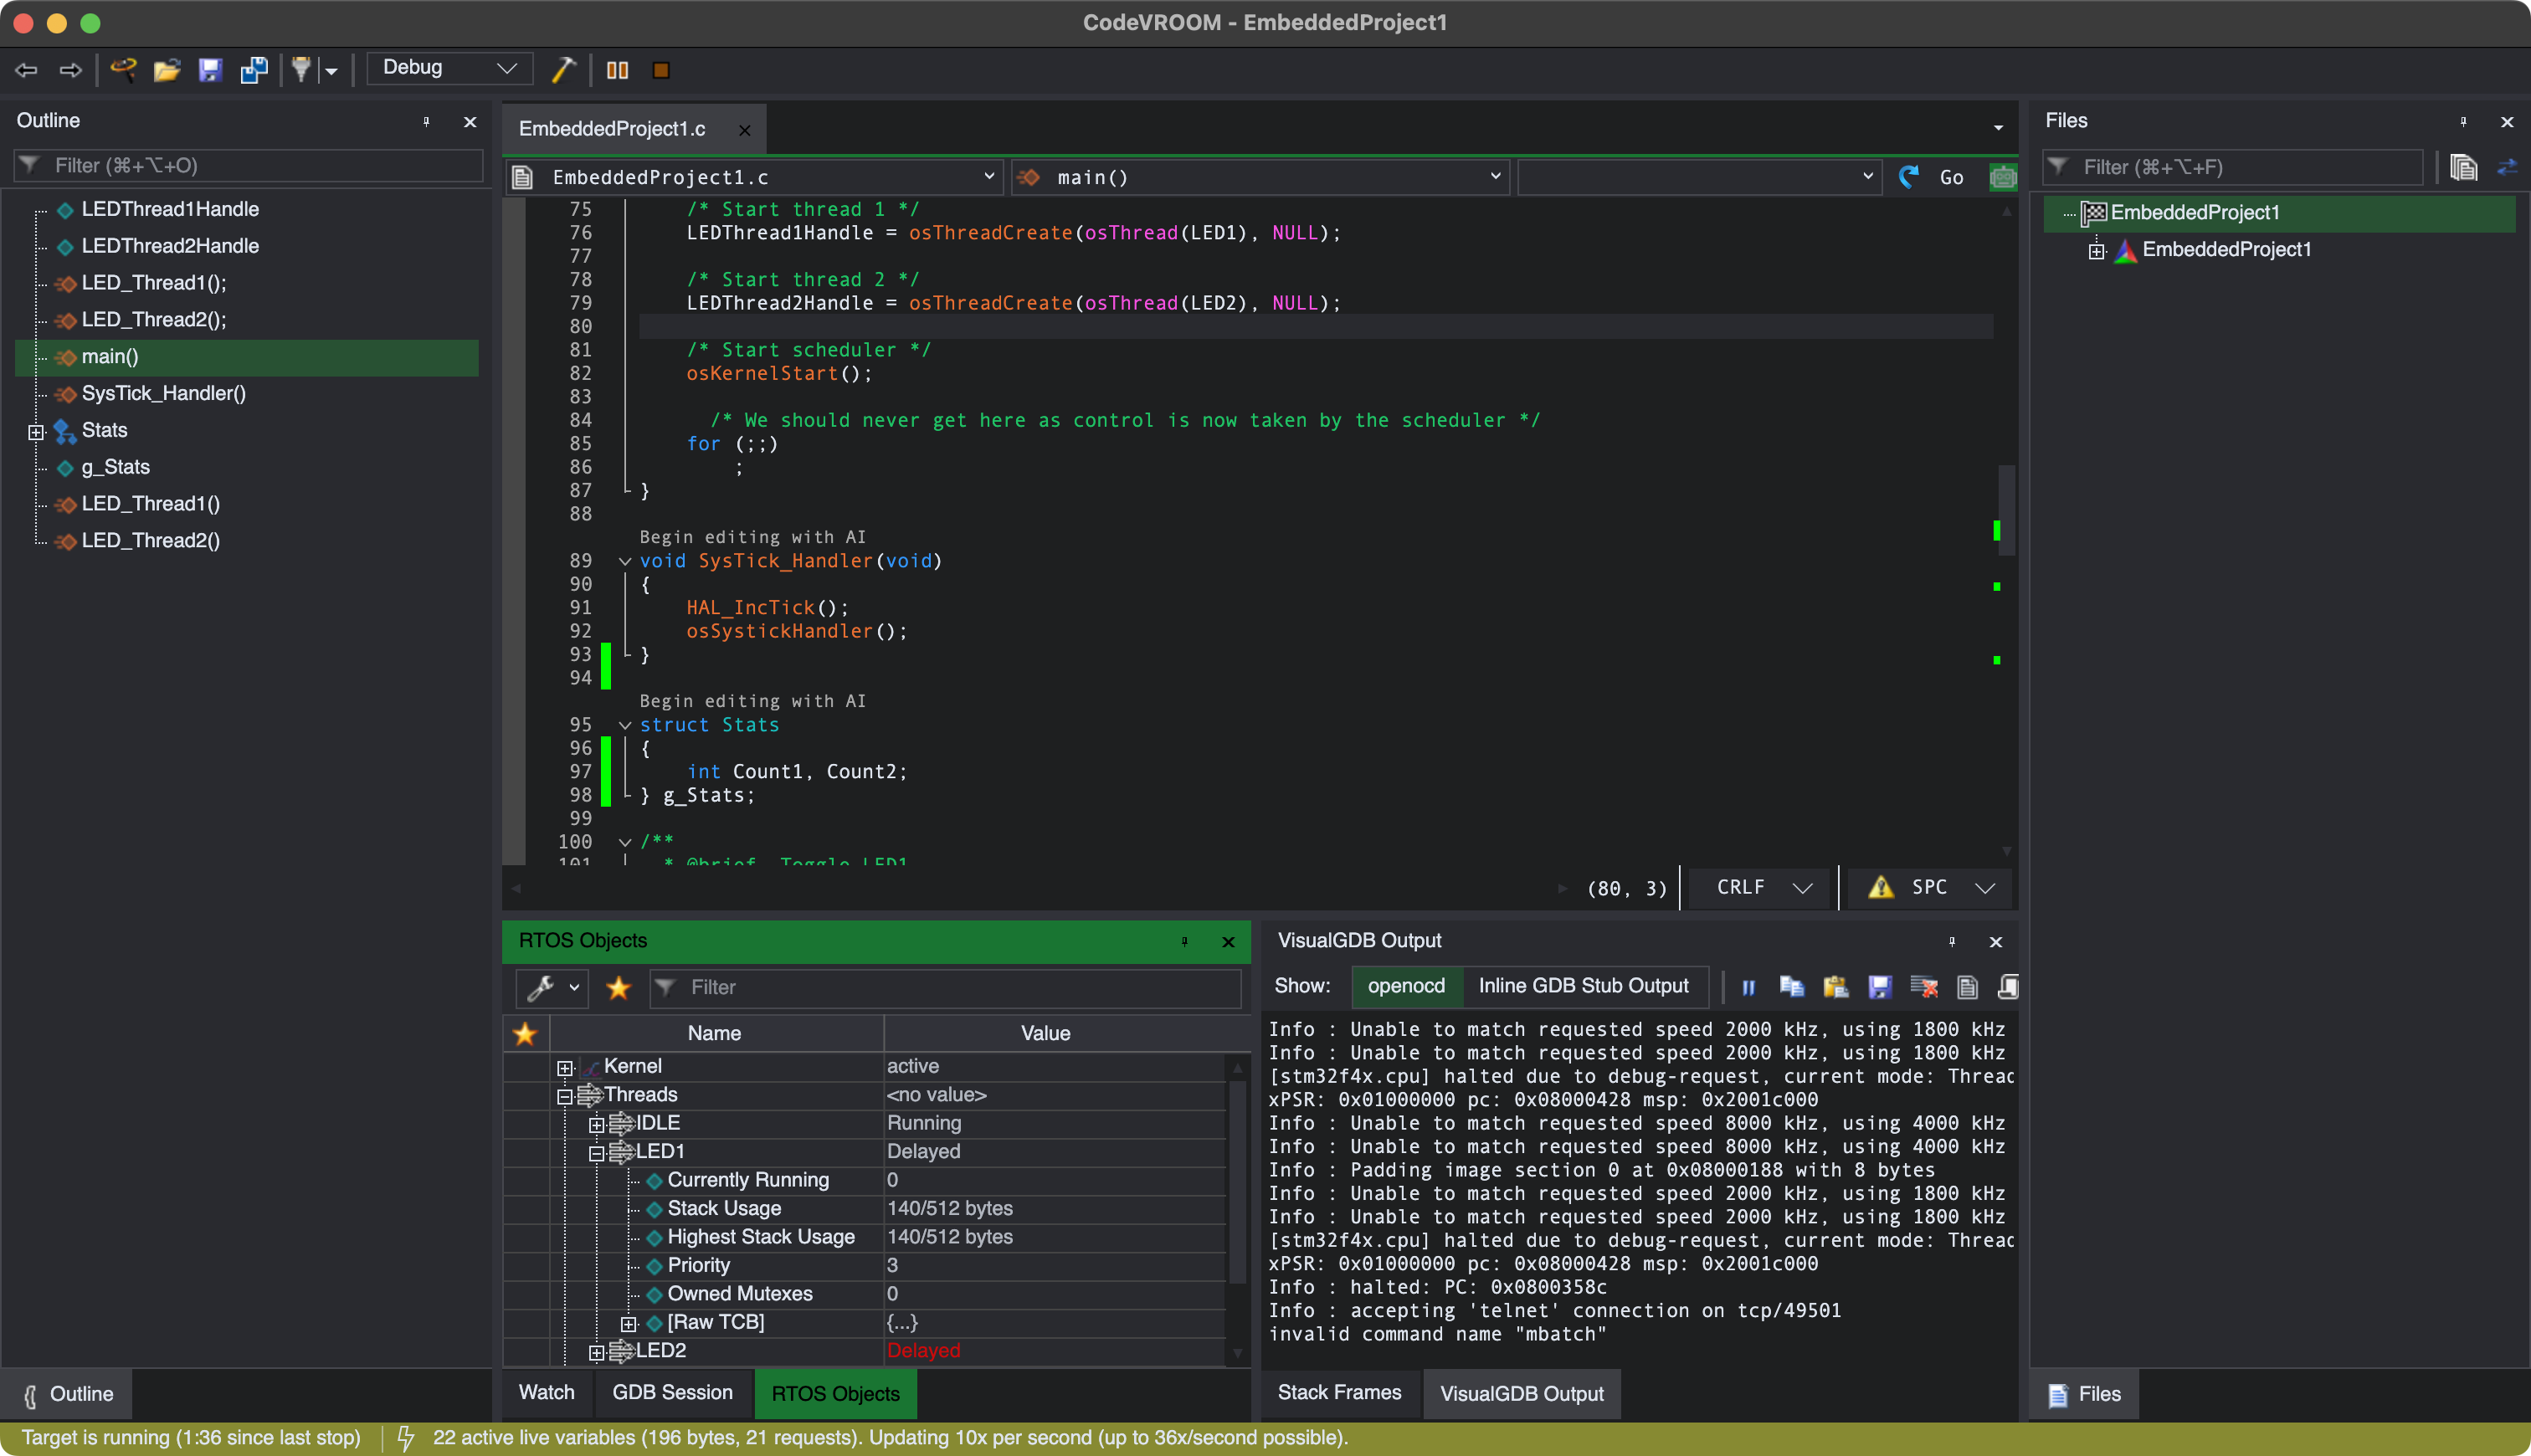
- Use the RTOS Objects view to get a real-time view of the threads, stacks, and synchronization primitives:
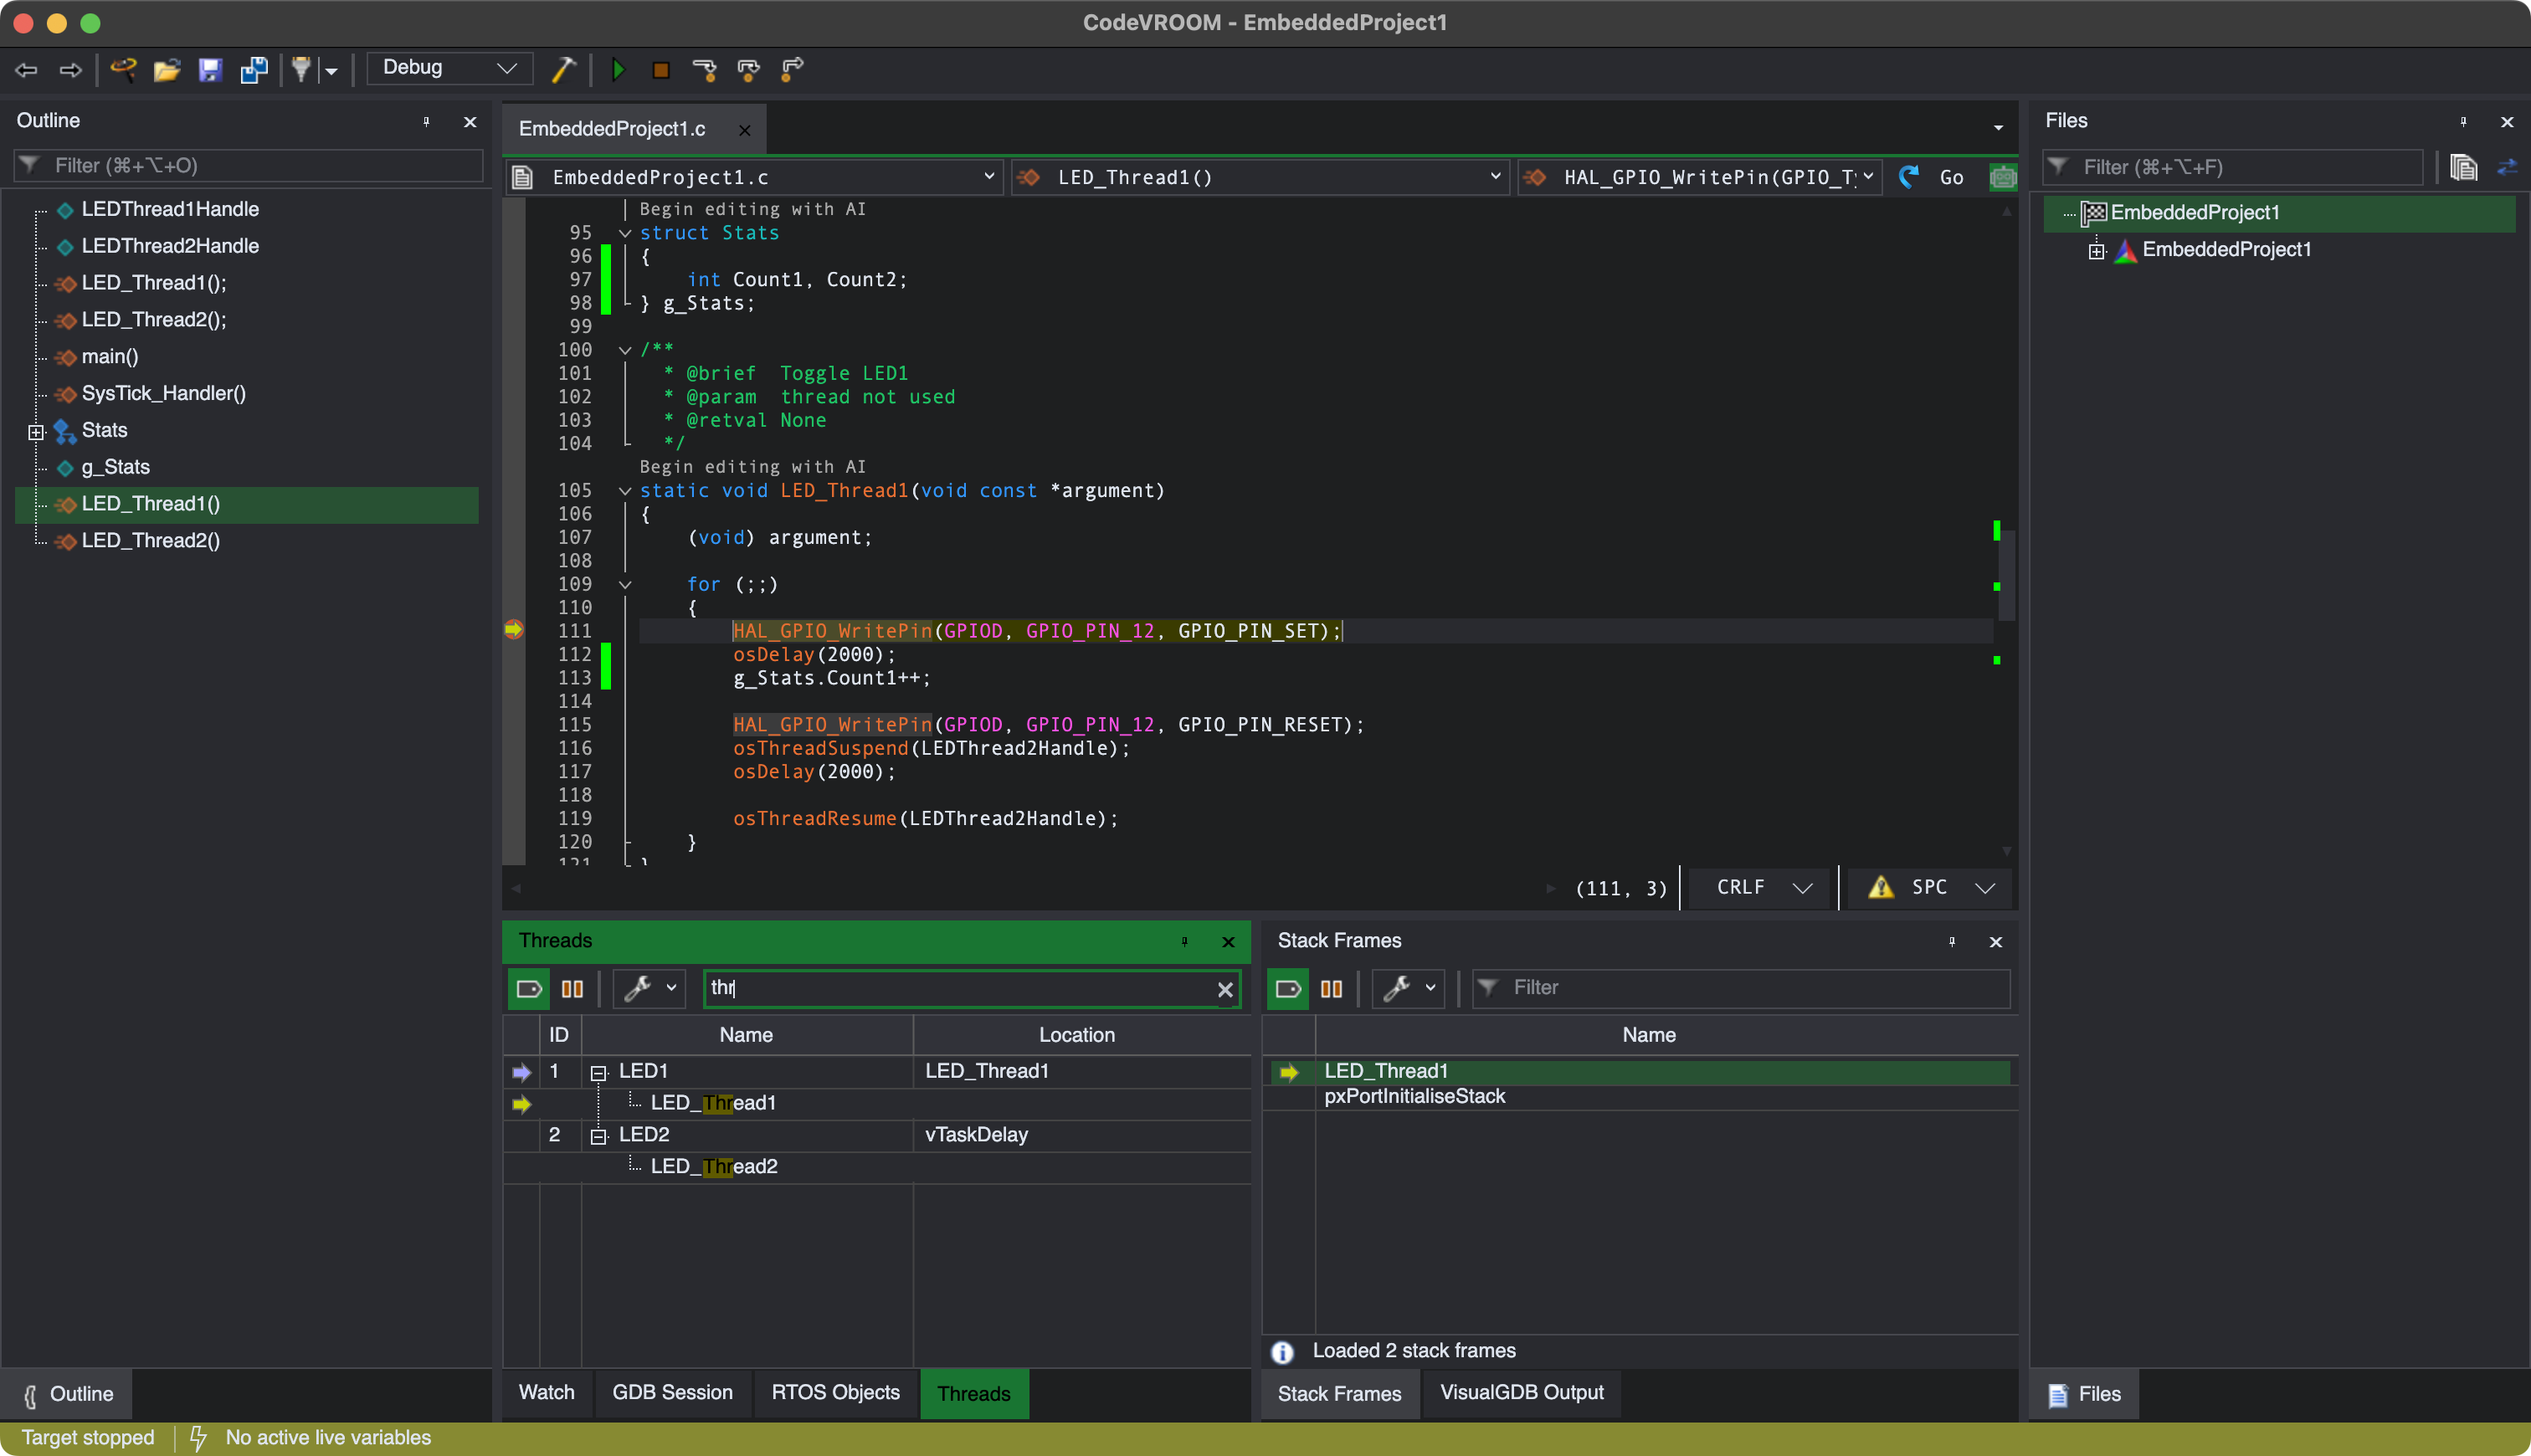
- Open the regular Threads window and try searching for the function name. Note how the matches are expanded and highlighted immediately:
- Go to the Peripheral Registers window and search for IDR. Locate GPIOD->IDR and pin it for live view:
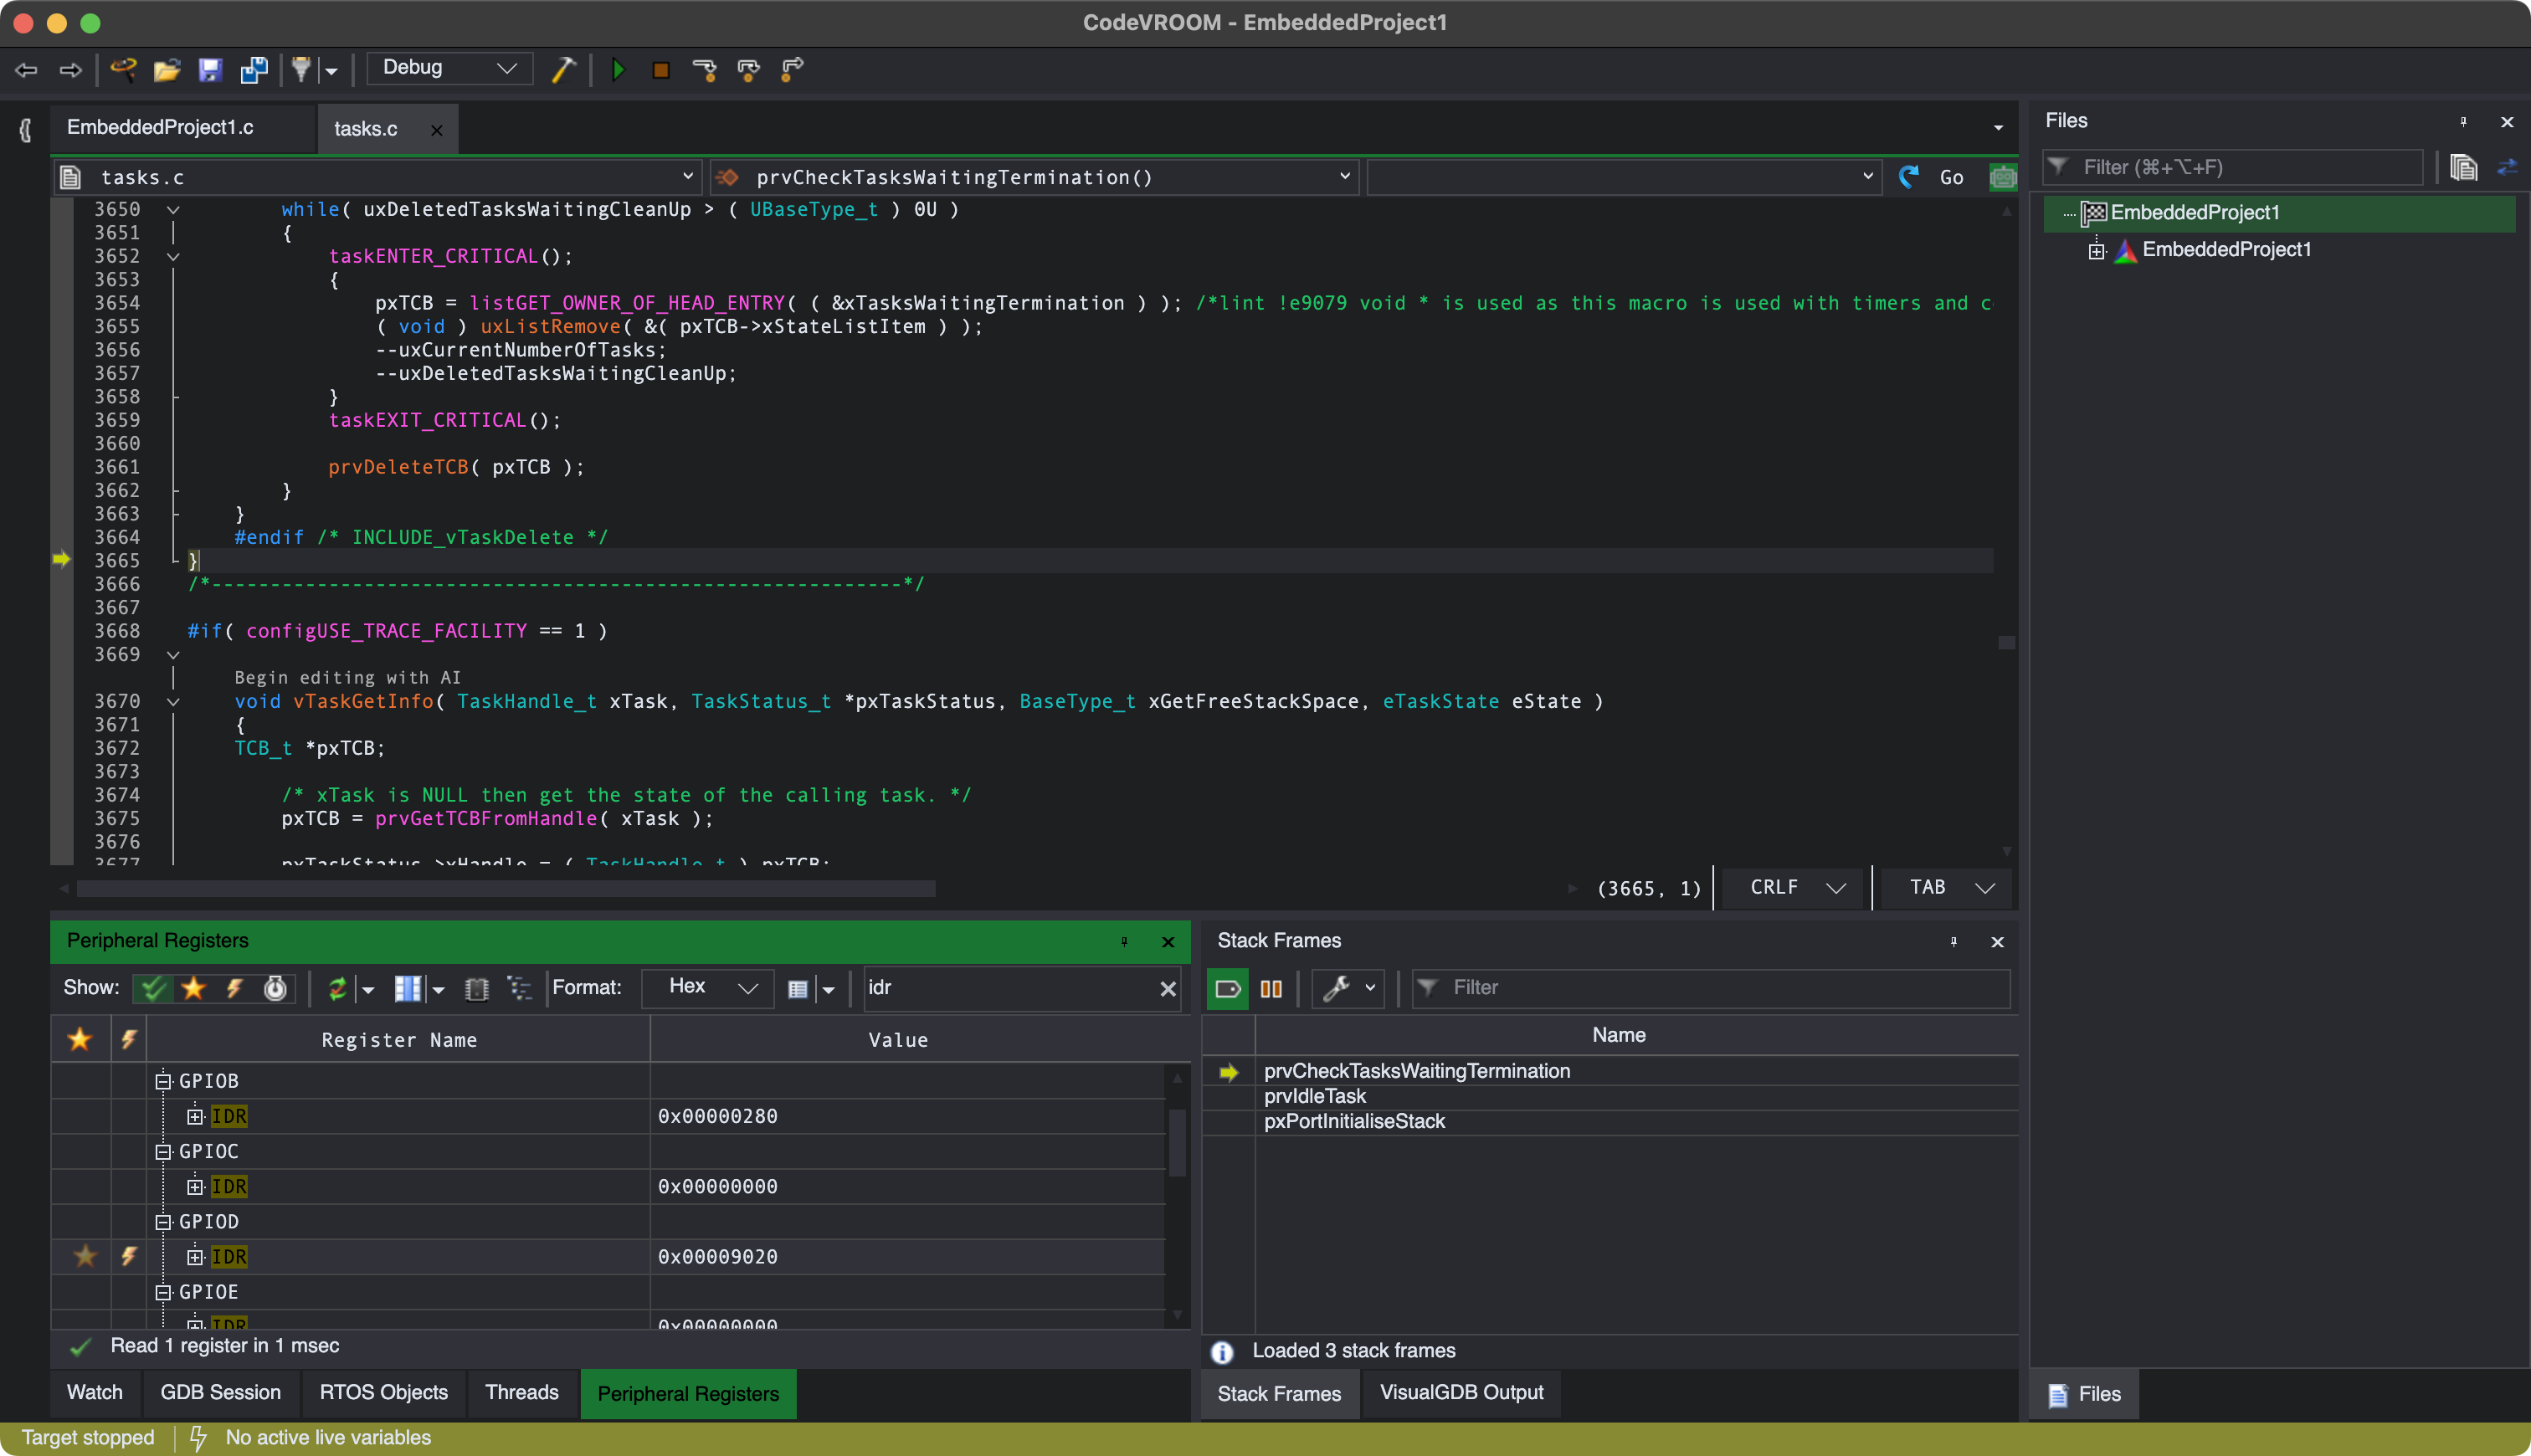
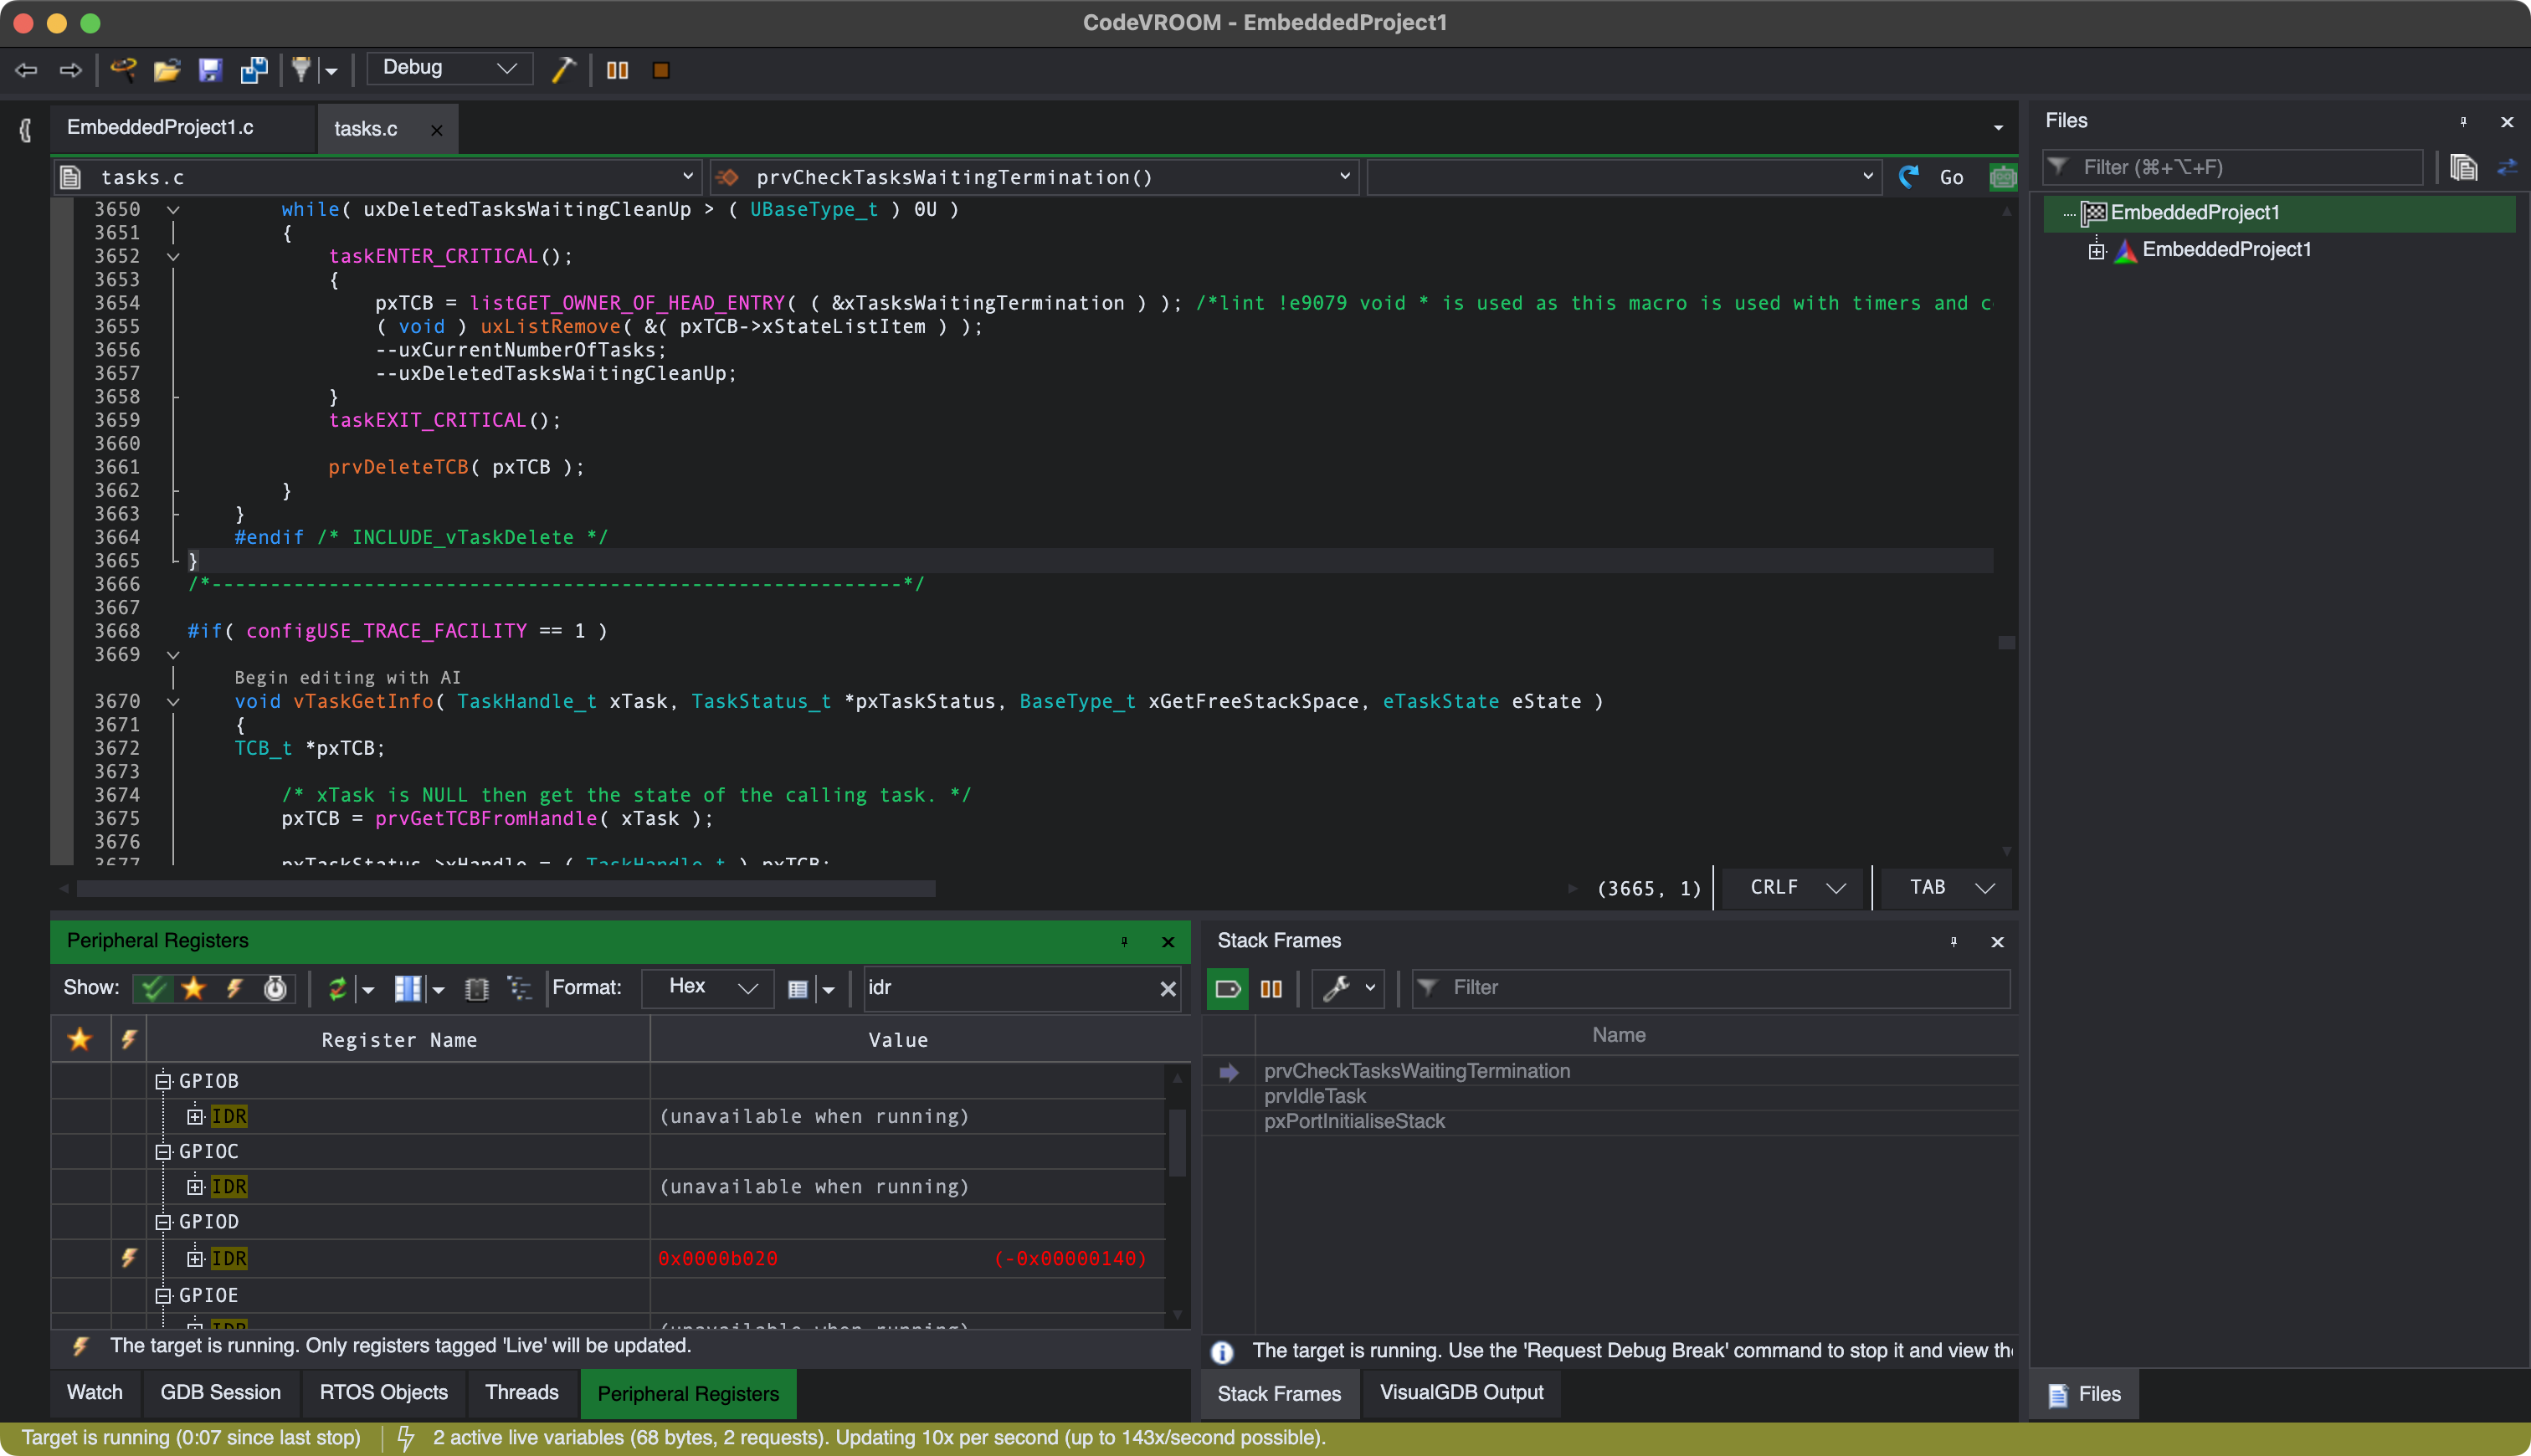
- Now you can see the value of the register in real-time as the program is running:
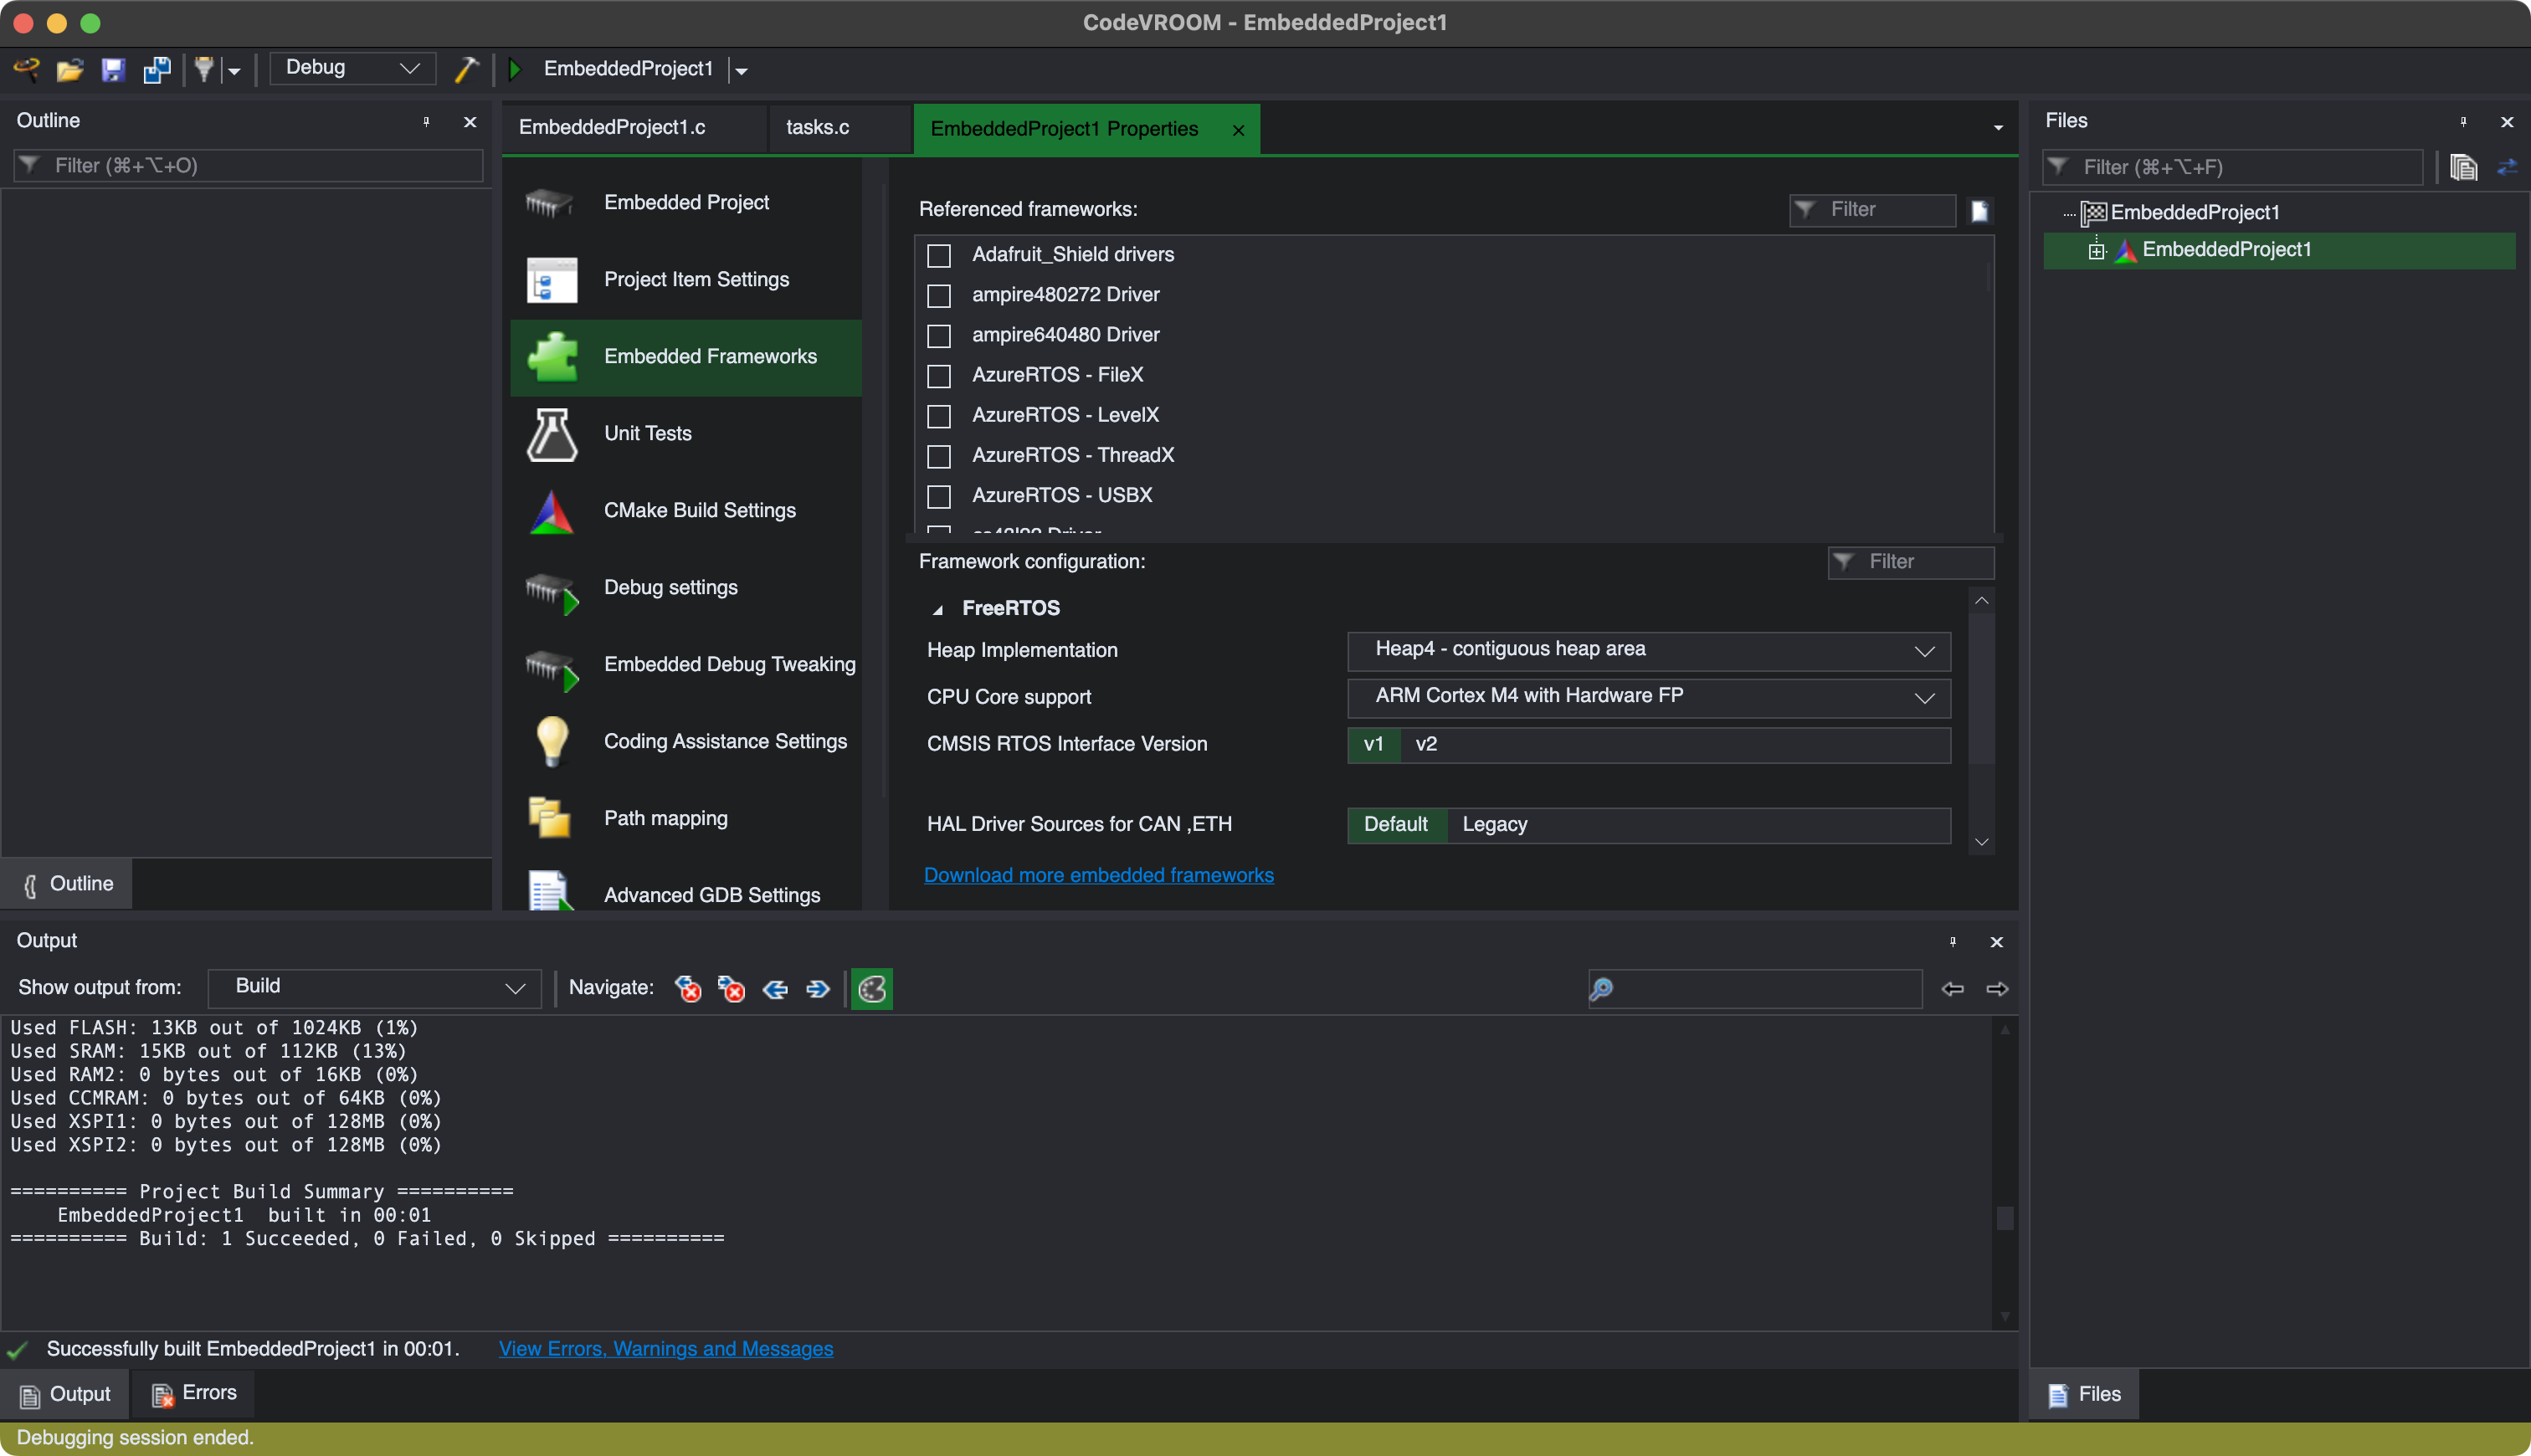
- You can use the Properties command in the project context window to edit various properties (e.g. reference the fast semihosting framework):