Developing Raspberry Pi Pico Projects with CodeVROOM
This tutorial shows how to create, build and debug a basic project for the Raspberry Pi Pico (RP2040) using the PicoSDK and CodeVROOM. We will be running CodeVROOM on Linux, but the same steps work for Windows and MacOS as well.
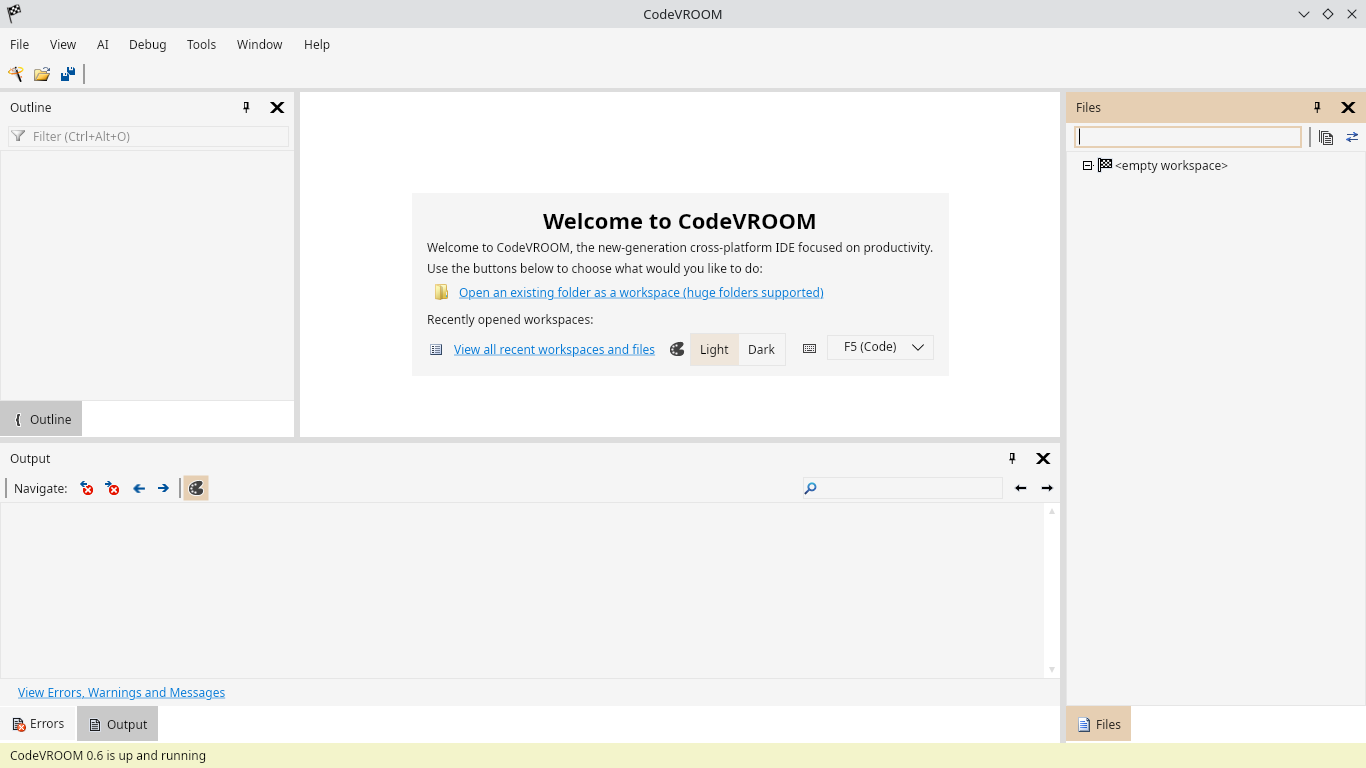
- Start CodeVROOM if you already created other projects with it, they will appear in the startup screen. Otherwise, click File->New->Project to begin:
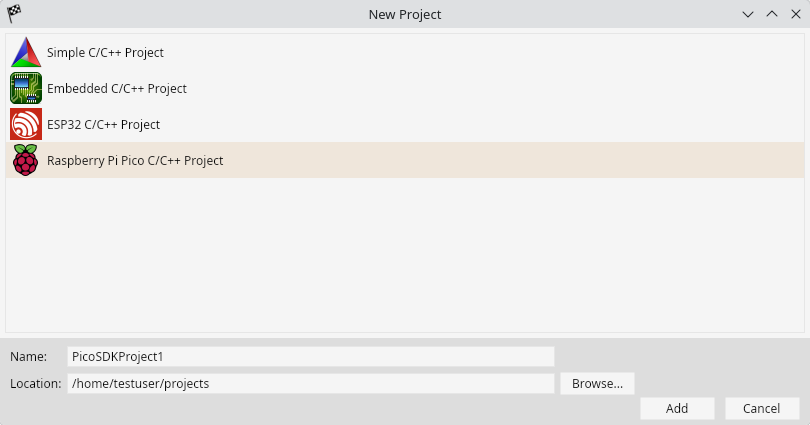
- Select the Raspberry Pi Pico project wizard:
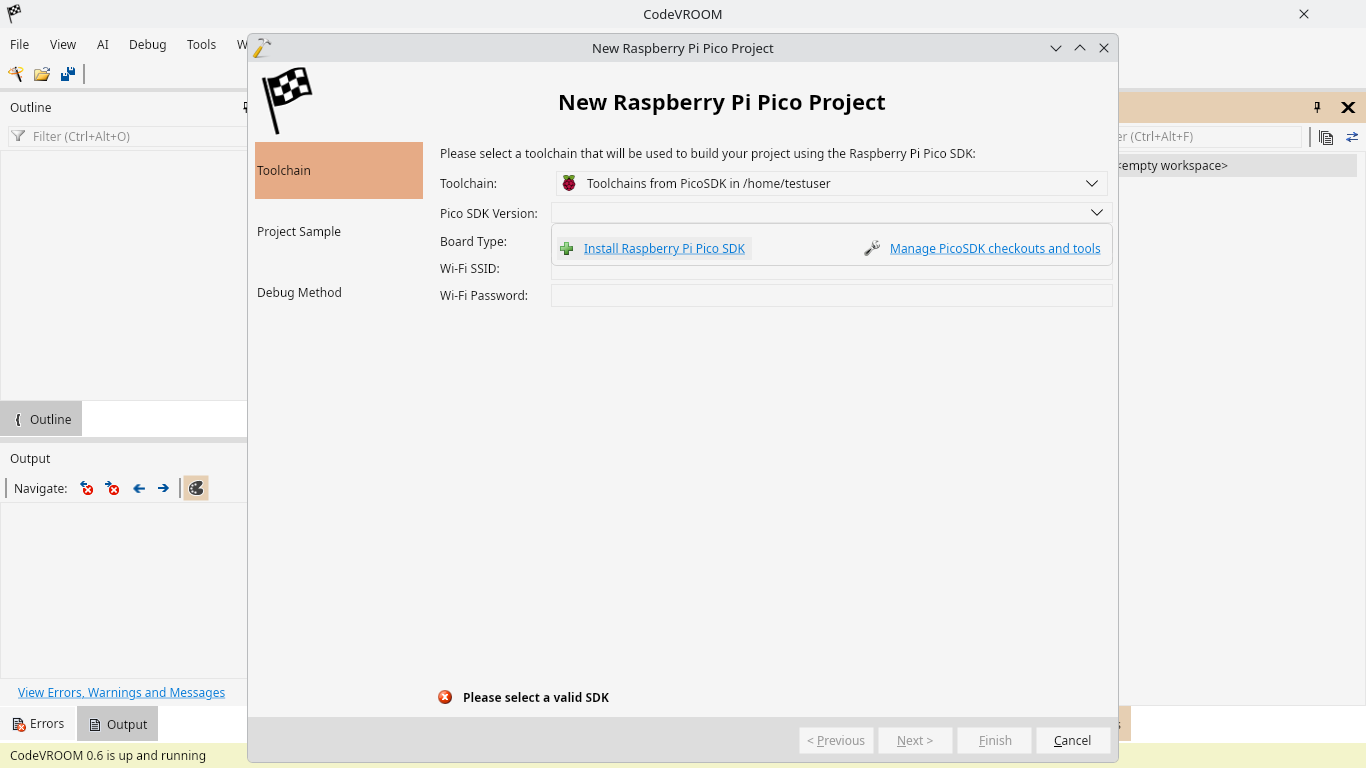
- The first page of the wizard allows selecting the PicoSDK version. CodeVROOM will automatically detect SDKs installed by the PicoSDK VS Code extension, but you can also install an SDK from scratch using the “install” button:
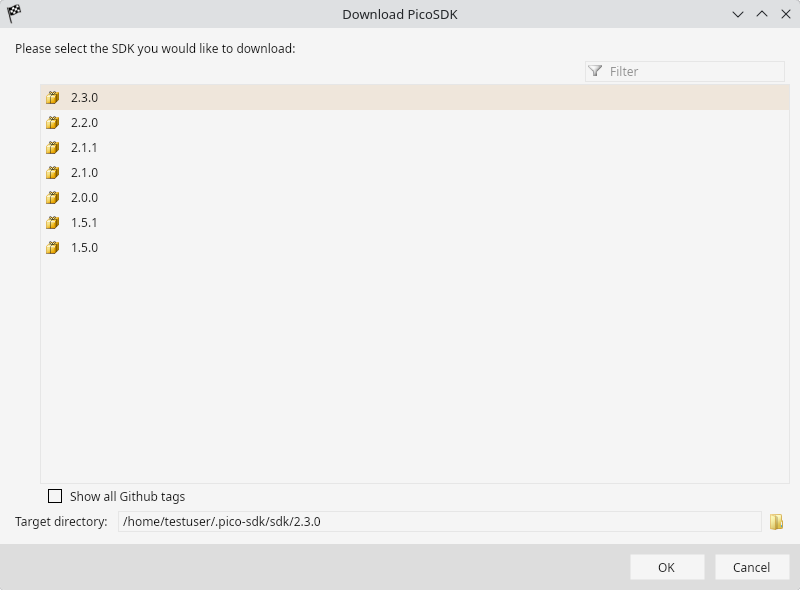
- Pick the version you would like to install:
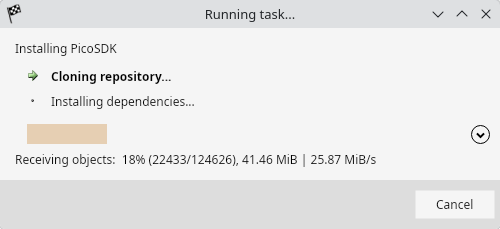
- CodeVROOM will automatically clone the Git repository and will install the dependencies:
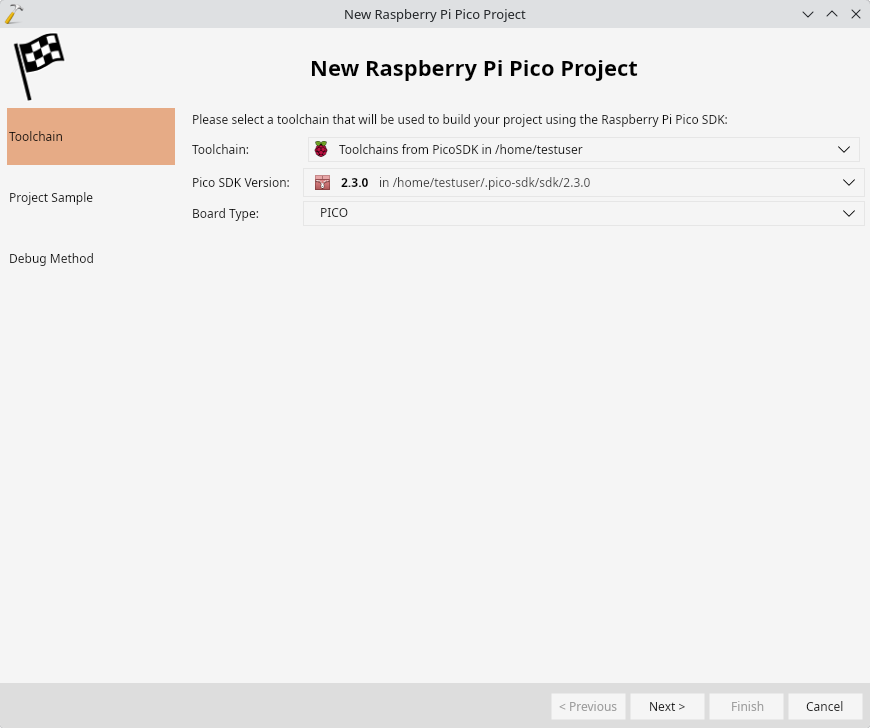
- Now you can select the target device and click “next”:
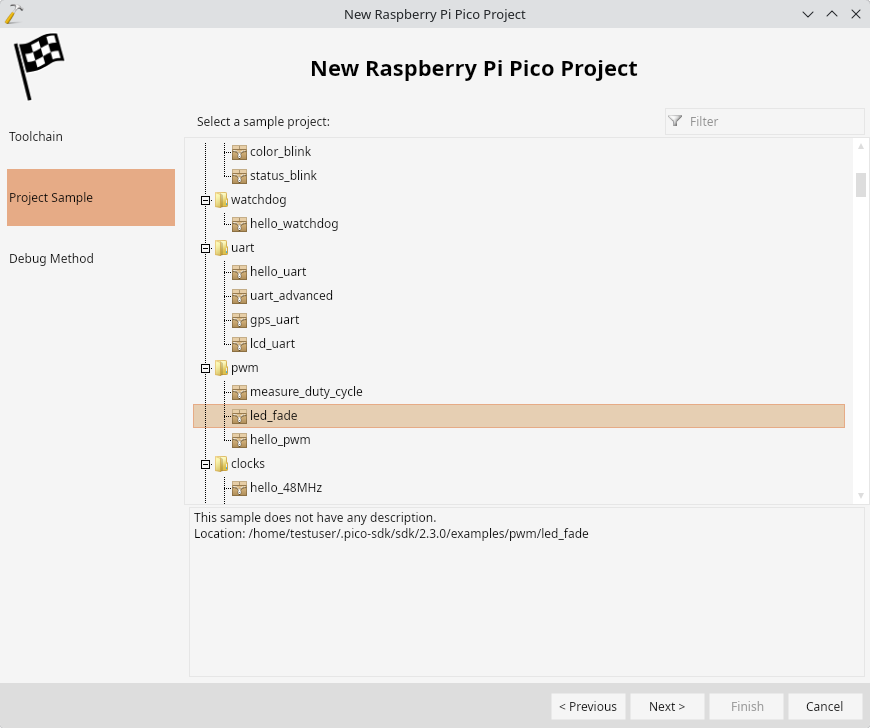
- Select the sample you would like to clone. In this tutorial we will clone the led_fade project from the SDK samples:
- Finally, select the debug settings that work for your configuration:
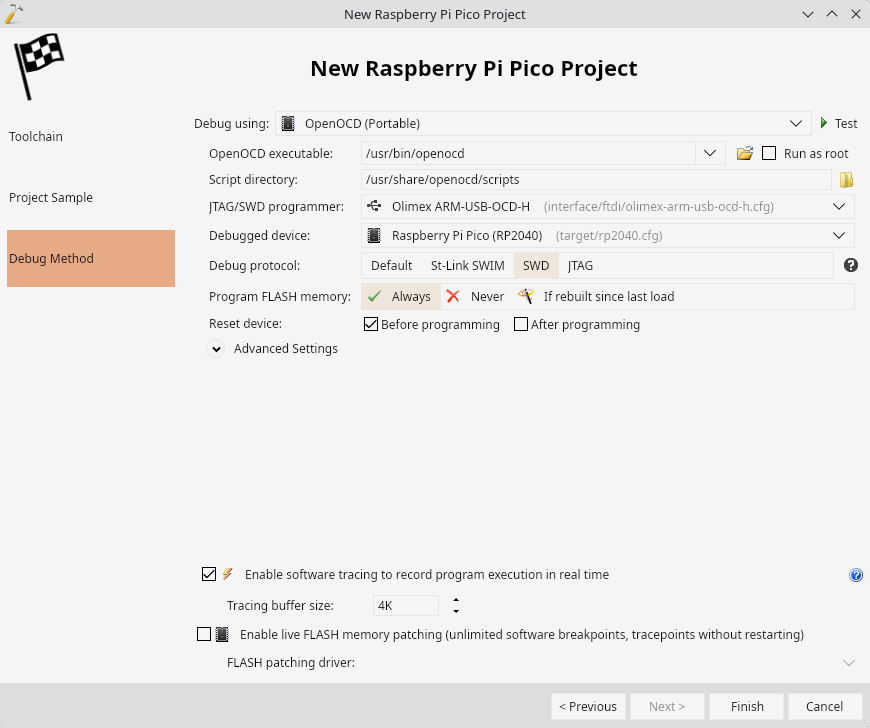
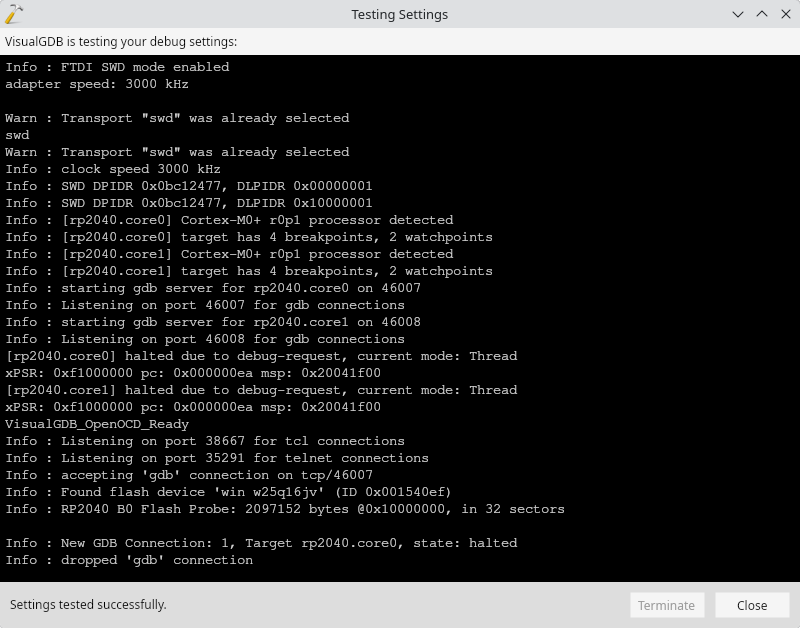
- You can use the Test button to automatically launch OpenOCD and verify that it can connect to the target:
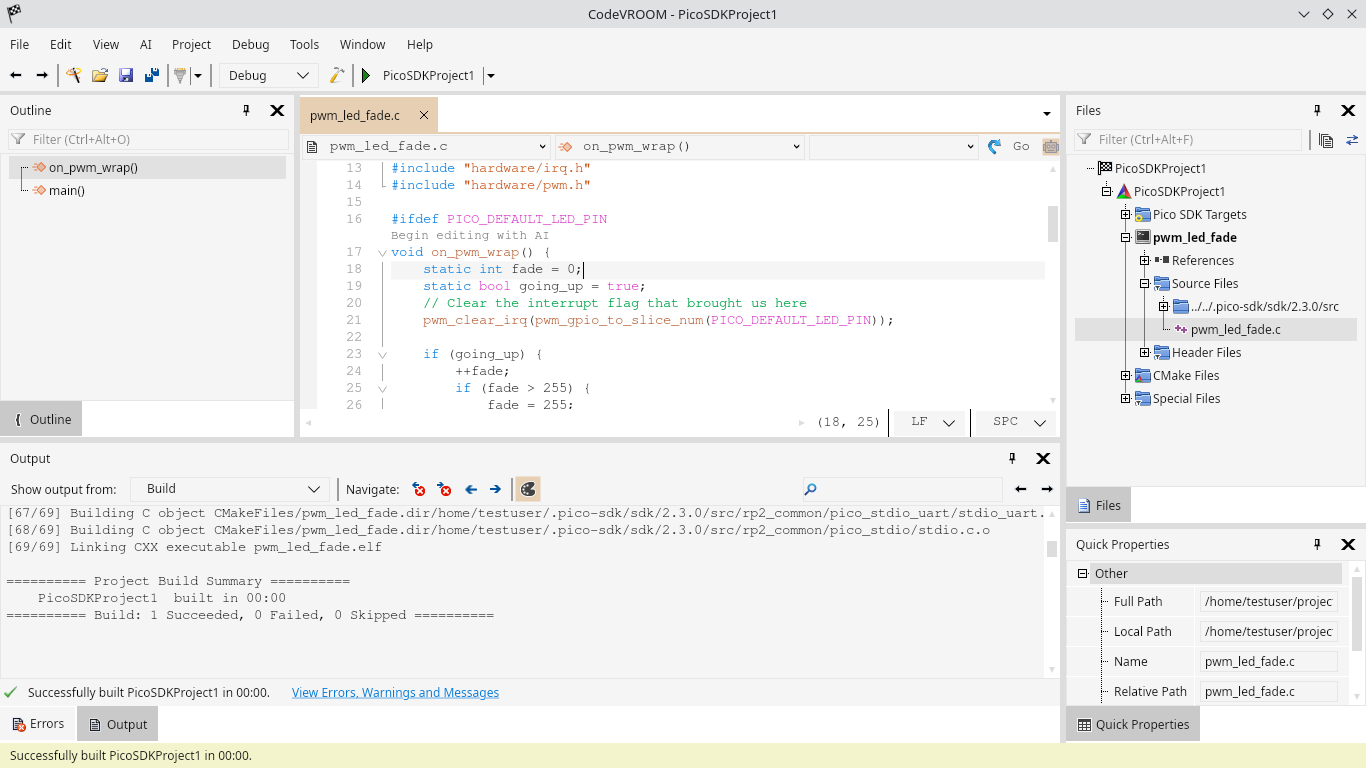
- Once the project got created, you can build it (Ctrl-Shift-B on PC, Cmd-Shift-B on Mac):
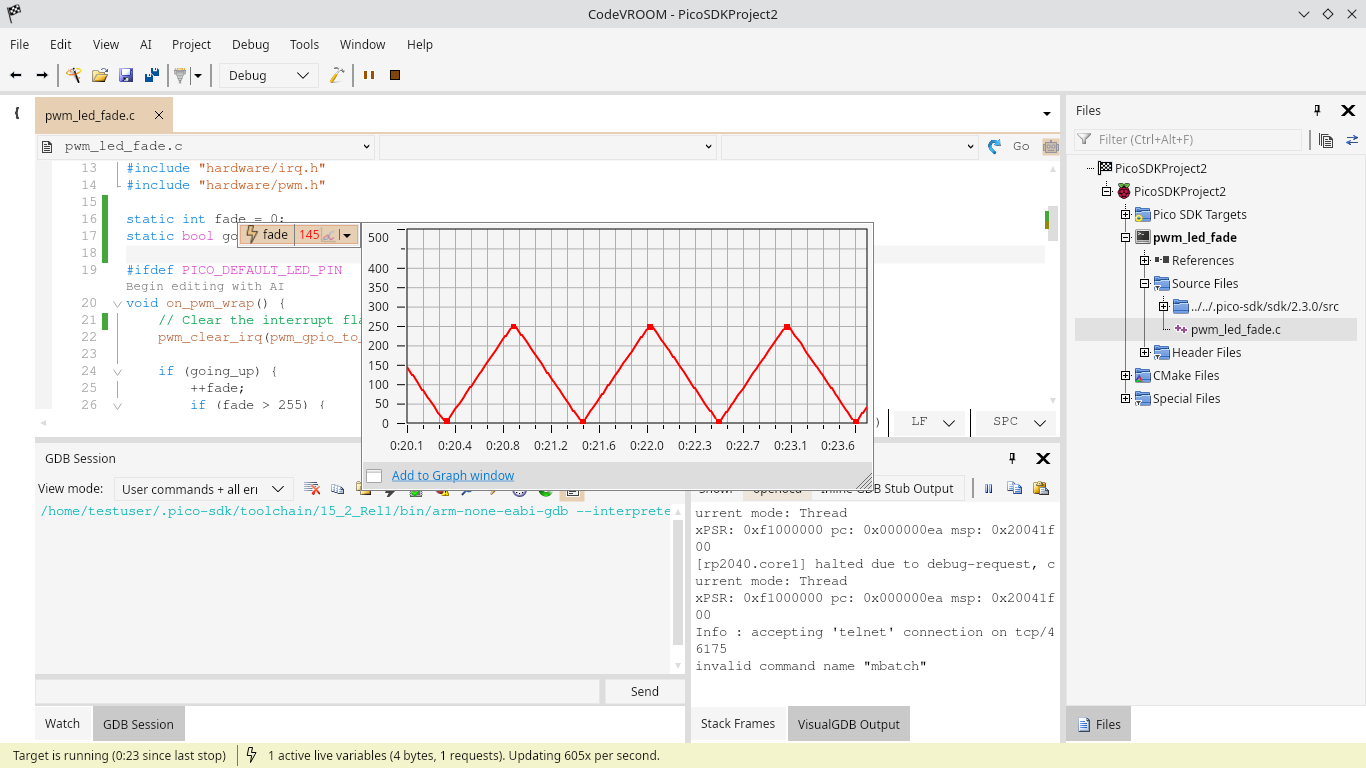
- We will now use the live memory to observe how the fading works without stopping the target. It will be easier to do it if we move the variables into the global scope. Now you can run the program, hover the mouse over “fade” and instantly see the value. Click the graph button to plot it in real time:
- If you want to view multiple variables on the same graph, you would need to use the dedicated Graph window. Right-click on the value of “fade” and select “Add to graph”:
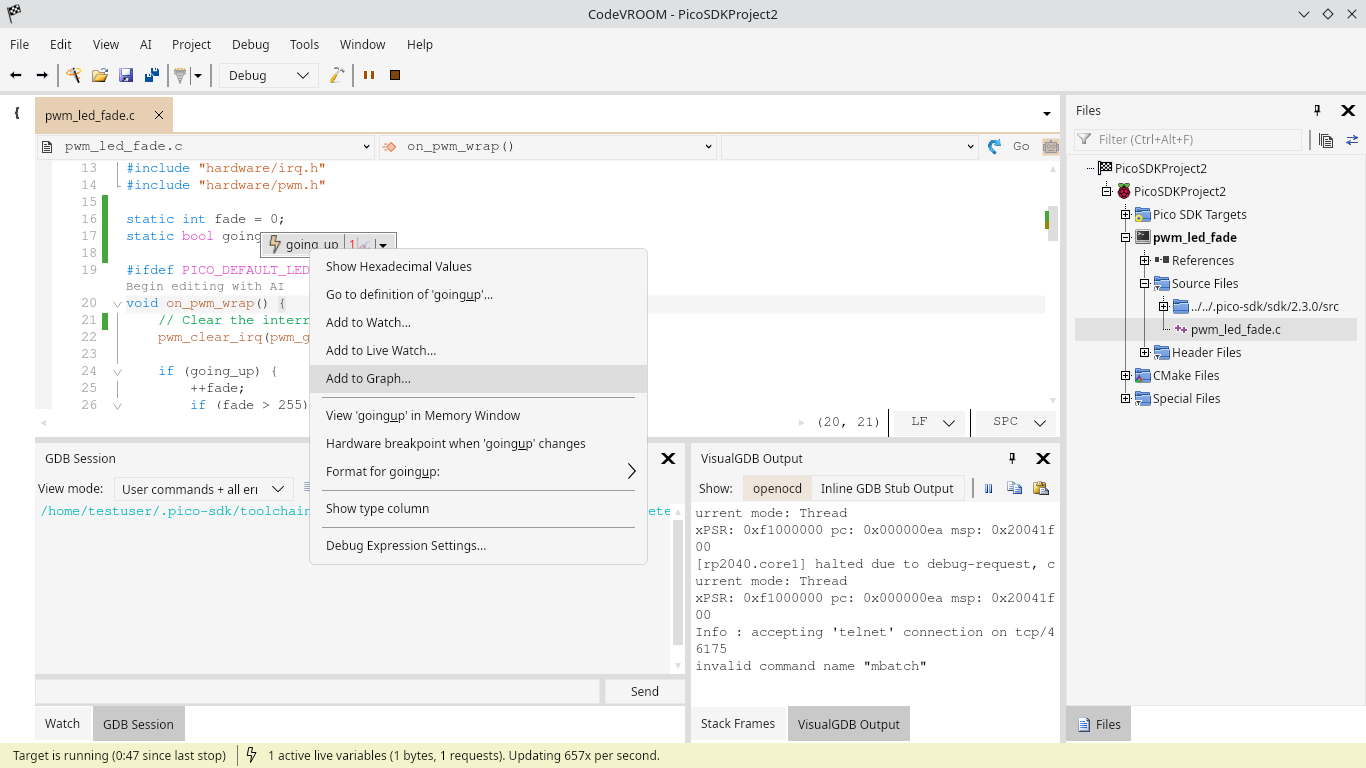
- Do the same for the going_up variable. Note that CodeVROOM kept the recorded values of ‘fade’ from the quick popup, but did not record it further until you added it to the graph:
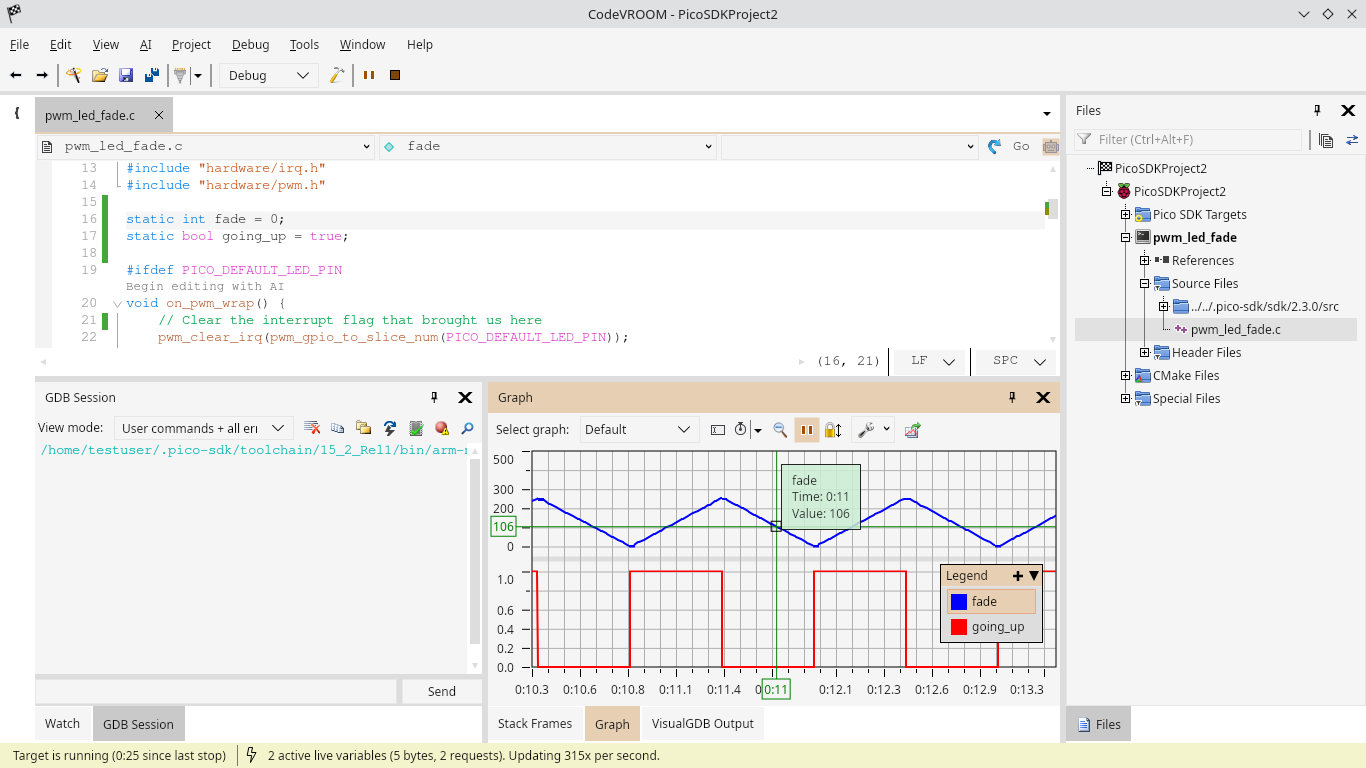
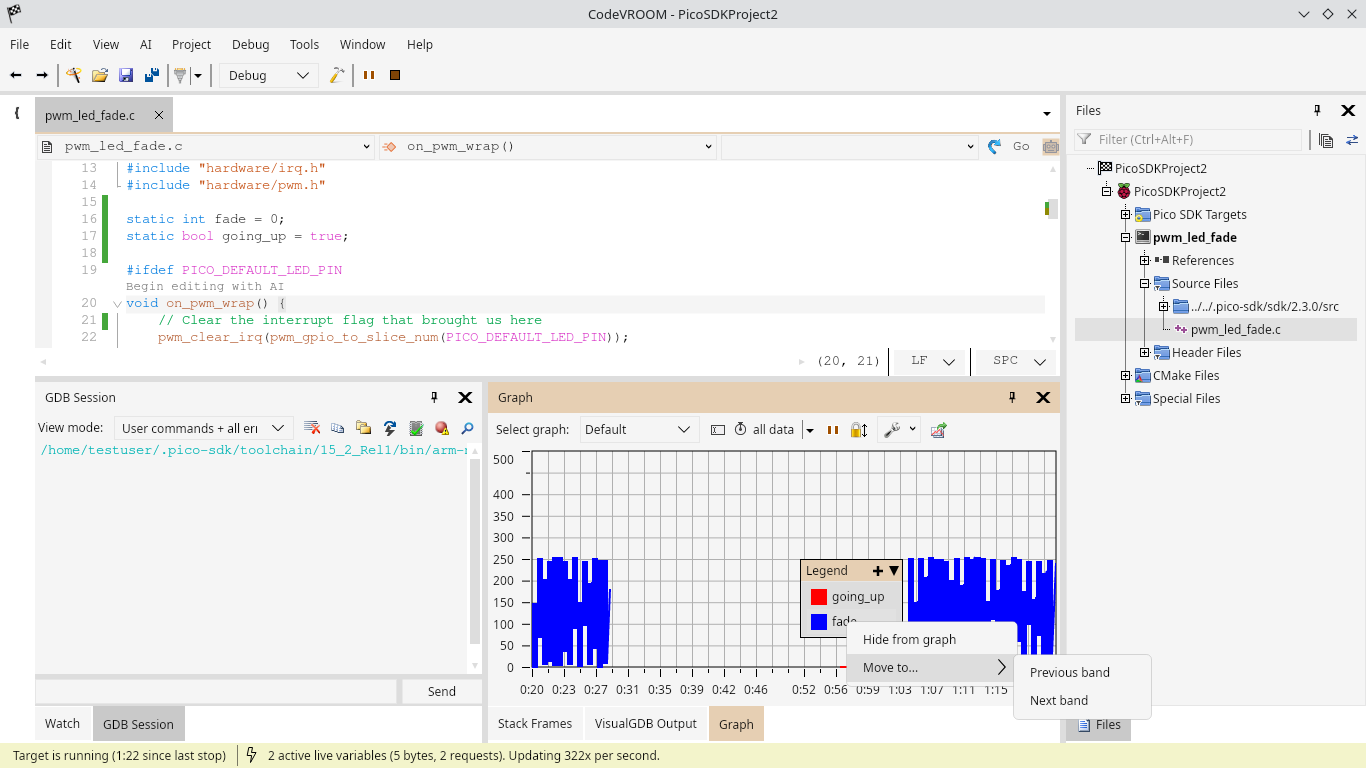 Also, as the ‘fade’ changes from 0 to 255, and ‘going_up’ is either 0 or 1, looking at them together is not very convenient. You can fix it by moving ‘fade’ to a separate band
 - If the graphs have too many data points, they will appear blocky when zoomed out. You can zoom in with the mouse wheel, or pan the view with the middle mouse button to see the full details:
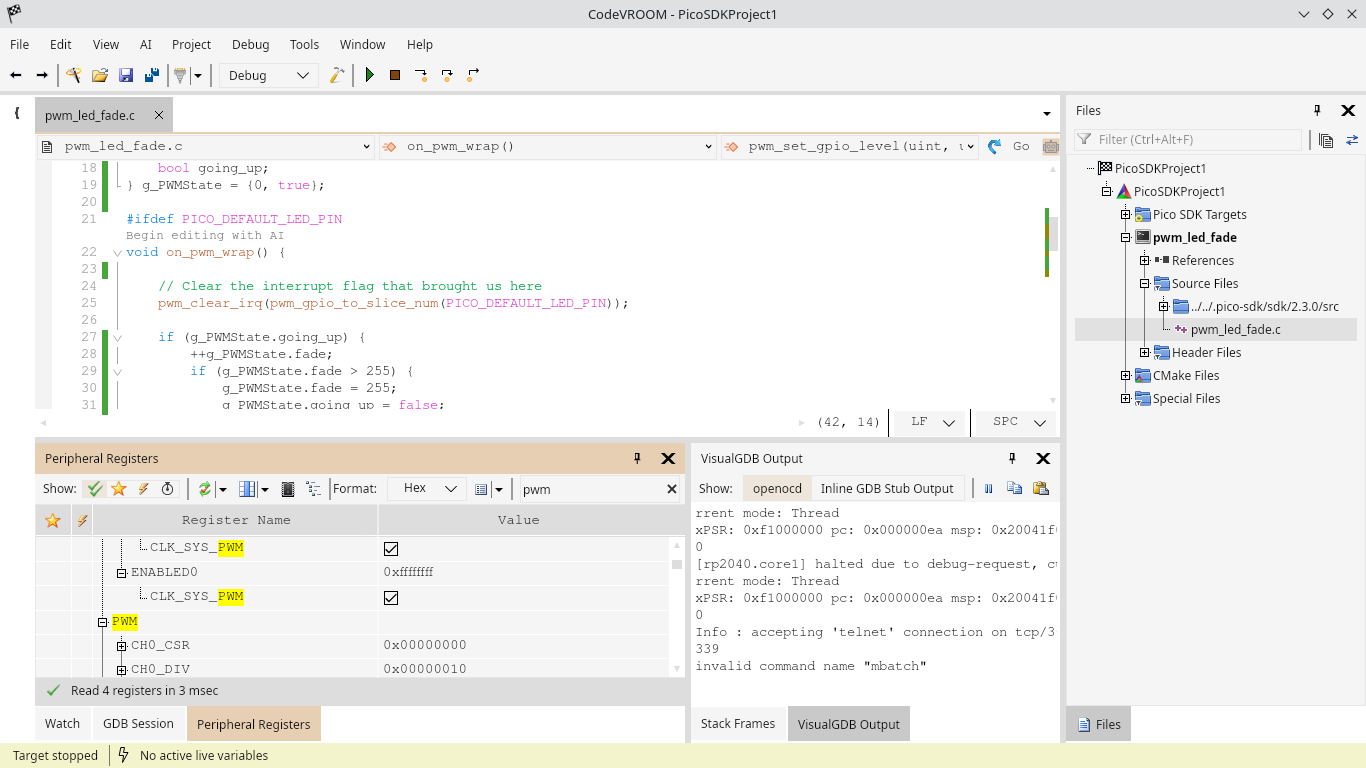
- You can also check various hardware registers related to PWM via the Debug->Windows->Peripheral Registers view. Flagging individual registers as live will allow observing them without stopping the target:
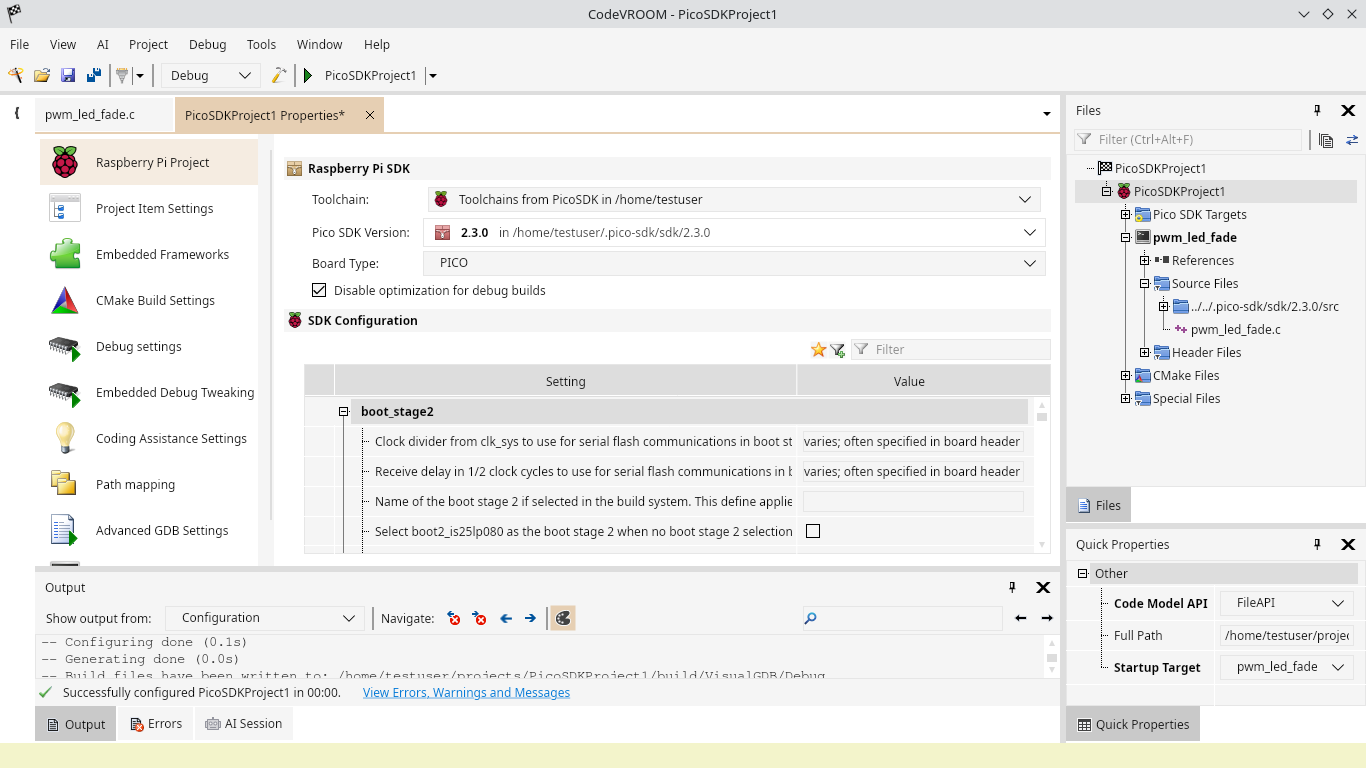
- You can edit various project properties (e.g. PicoSDK configuration variables) by selecting the “Properties” command in the project context menu: