Creating Embedded Projects on Linux
This tutorial shows how to create a basic STM32 project on Linux using CodeVROOM.
Before you begin, install the following packages:
| Package | Name in APT |
| GCC for ARM | gcc-arm-none-eabi |
| Ninja | ninja-build |
| CMake | cmake |
| OpenOCD | openocd |
| Embedded GDB | gdb-multiarch |
Also, make sure your system has a functioning xz executable, since CodeVROOM uses it to unpack the device packages.
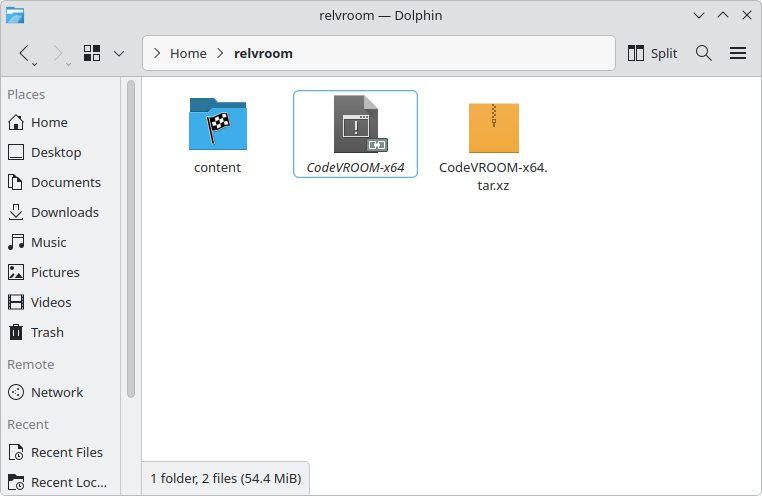
Once all the prerequisites have been fulfilled, download the latest CodeVROOM archive and unpack it.
- CodeVROOM for Linux is distributed in .tar.xz files that include all the necessary binaries. To start it, run CodeVROOM-<platform>:
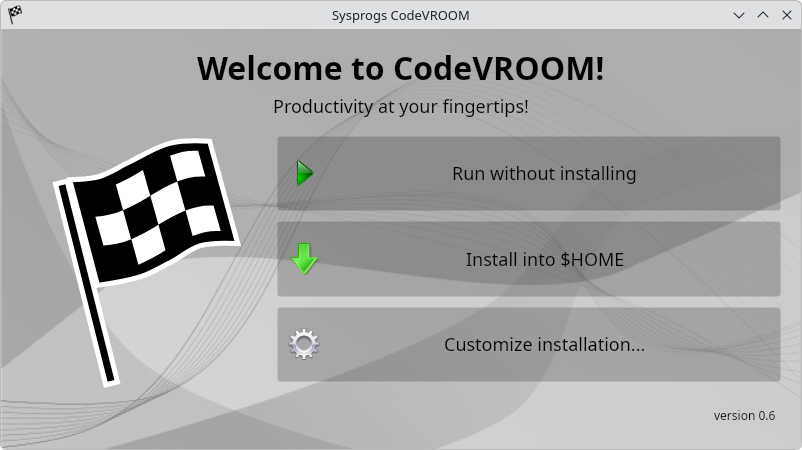
- CodeVROOM does not need installation, so you can click “Run without installing”, or install it to any location of your choice:
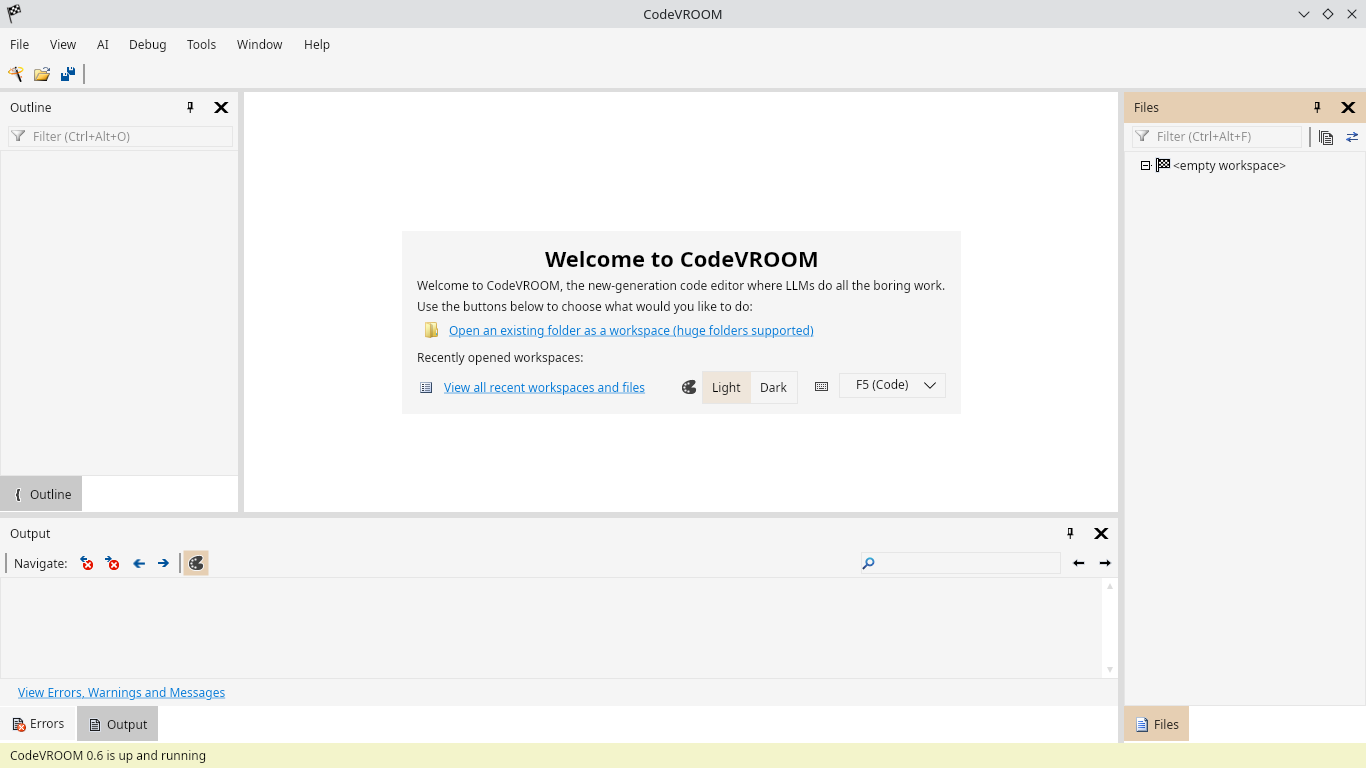
- The installation only takes a few seconds and simply copies the files to another location and creates shortcuts. Once installed, or ran in-place, the main window will look like this:
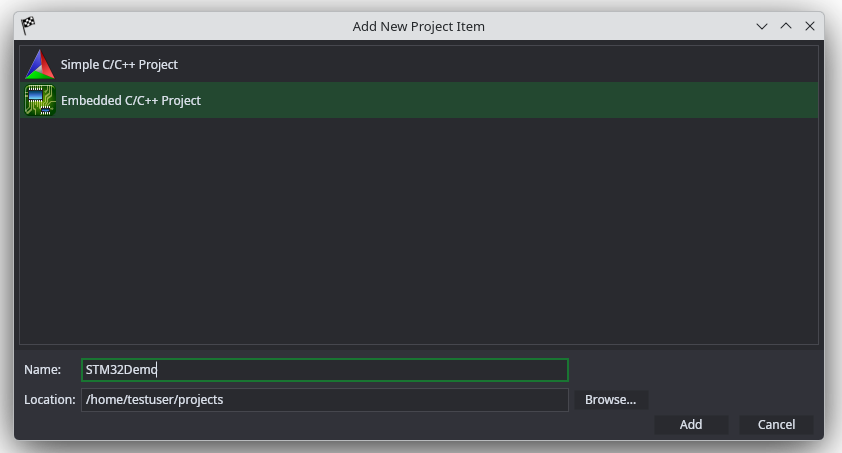
- Select File->New->Project or use the toolbar command to open the project wizard selector. Select the CMake project wizard:
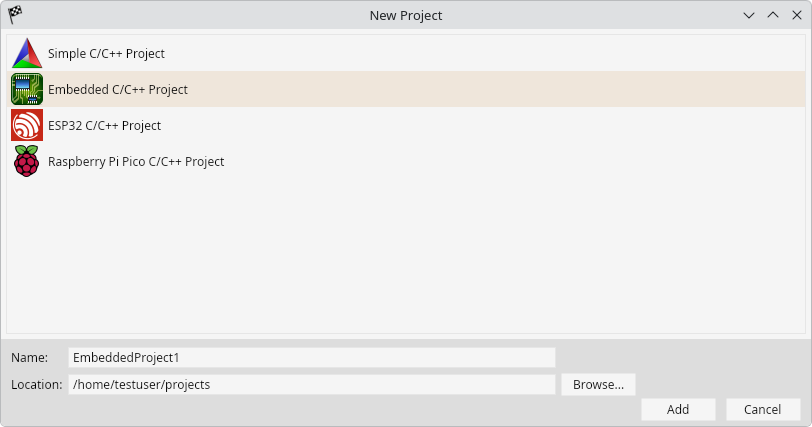
- Proceed with the default choices for the project type:
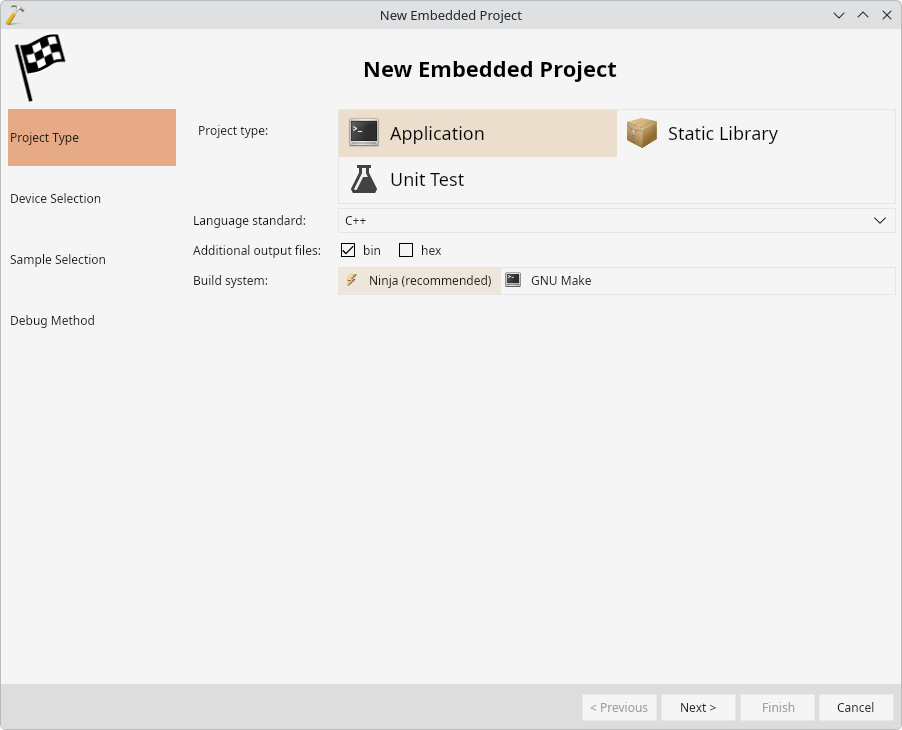
- The next page allows selecting a toolchain to use. As of version 0.6, CodeVROOM only supports the embedded ARM toolchain (except the separate ESP32 wizard), and it needs to be pre-installed via a package manager. Once it is selected, CodeVROOM will show a list of devices compatible with the toolchain:
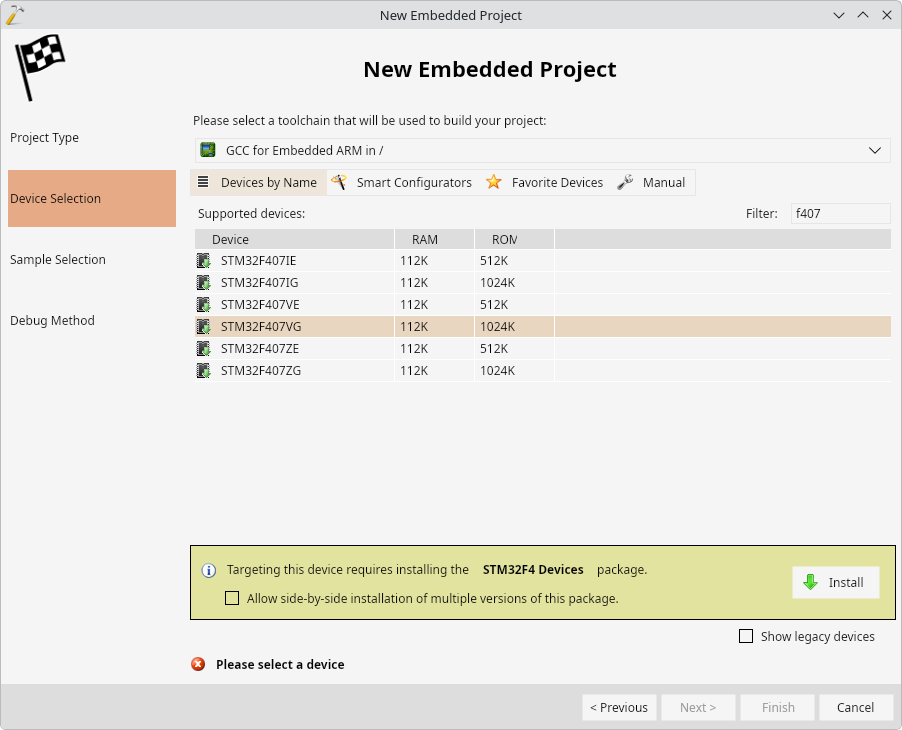 Select the device and click “Install” to proceed with the installation.
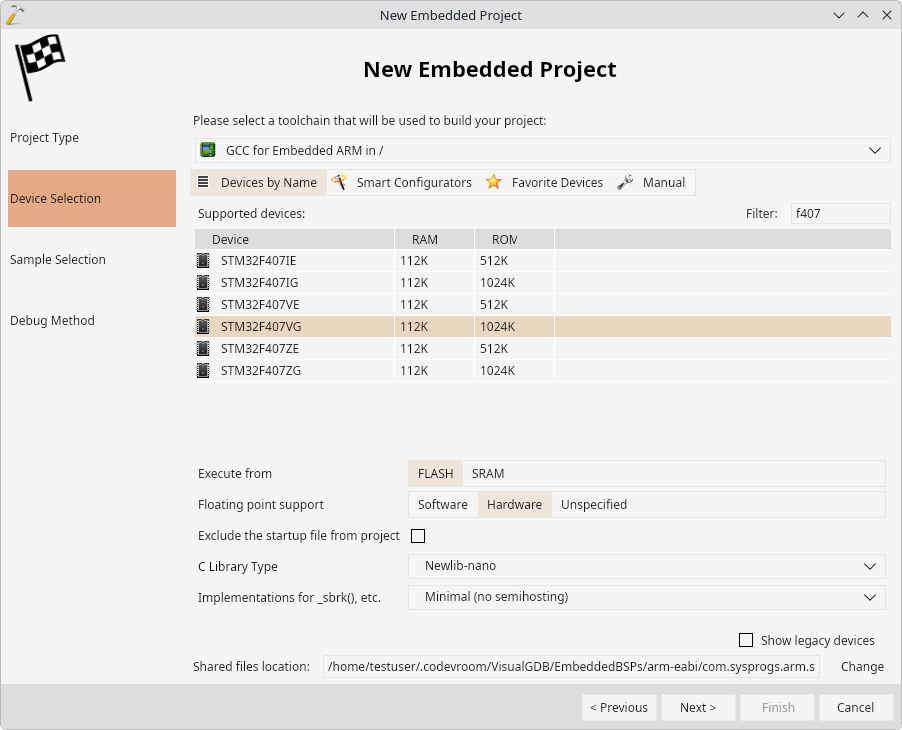
 - Once the package is installed, CodeVROOM will show the configuration options for the device. Proceed with the default ones:
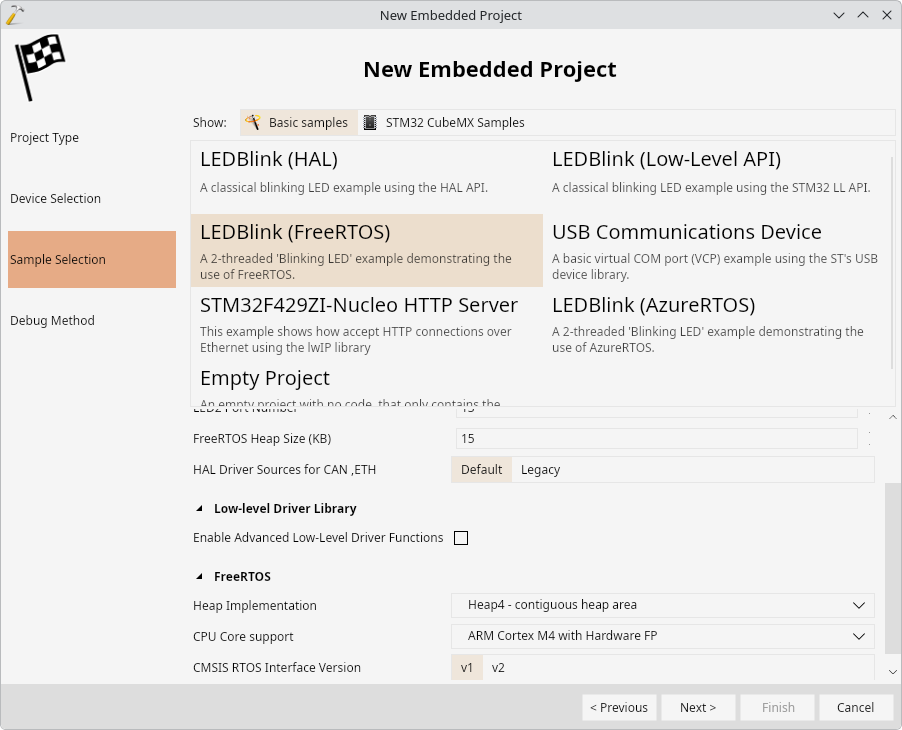
- The next page allows choosing between basic project samples and vendor-supplied templates. Select “LEDBlink (FreeRTOS)” sample in the regular list:
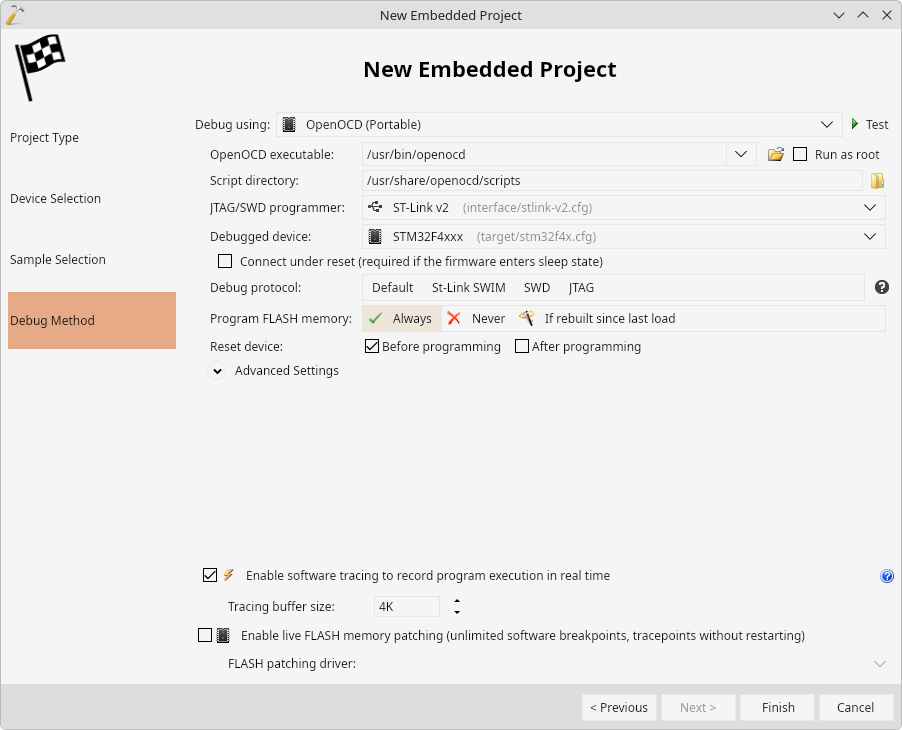
- Finally, let’s configure debugging settings. On Linux/Mac CodeVROOM relies on the system-level openocd installation (sudo apt install openocd), so make sure it is installed. The wizard will automatically pre-select the device script, and will show a searchable drop-down of known debugging interfaces:
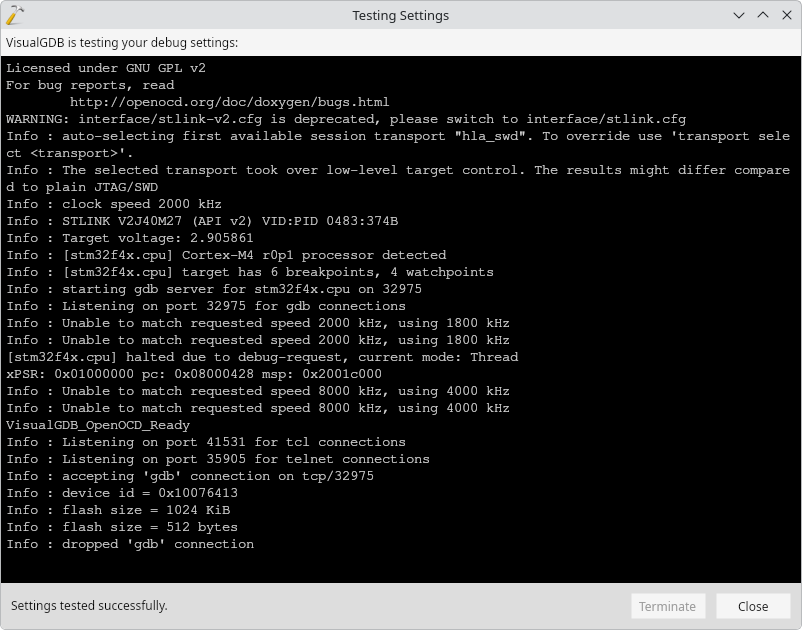
- Select the settings that match your configuration and click “test” to verify them:
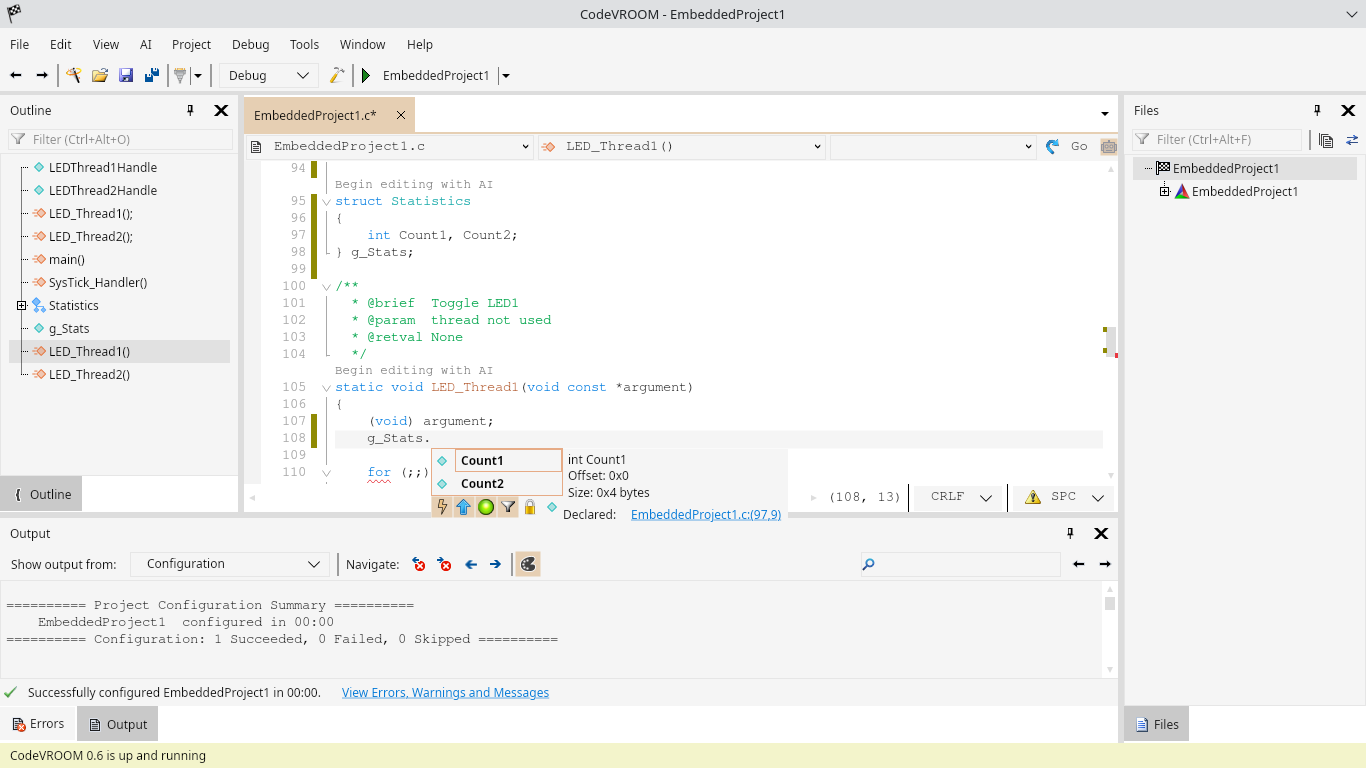
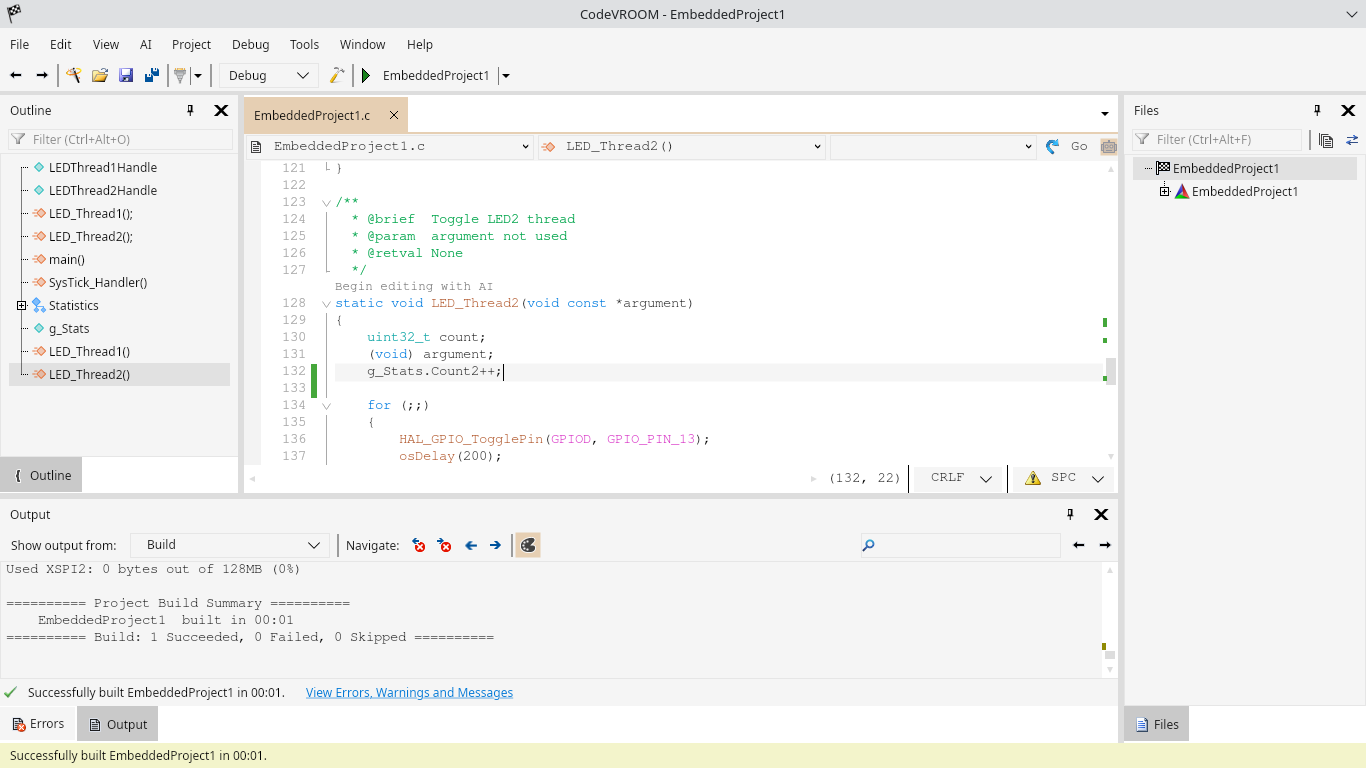
- Once the project got created, let’s modify it, adding the iteration counters to the threads. Add a g_Stats structure with 2 fields, and update threads to increment them within the loops:
- Build the project (Ctrl-Shift-B or Ctrl-B, depending on the selected keyboard layout):
- Set a breakpoint before the call to HAL_GPIO_Init() and press F5 (or F11 for Eclipse keyboard layout) to start debugging:
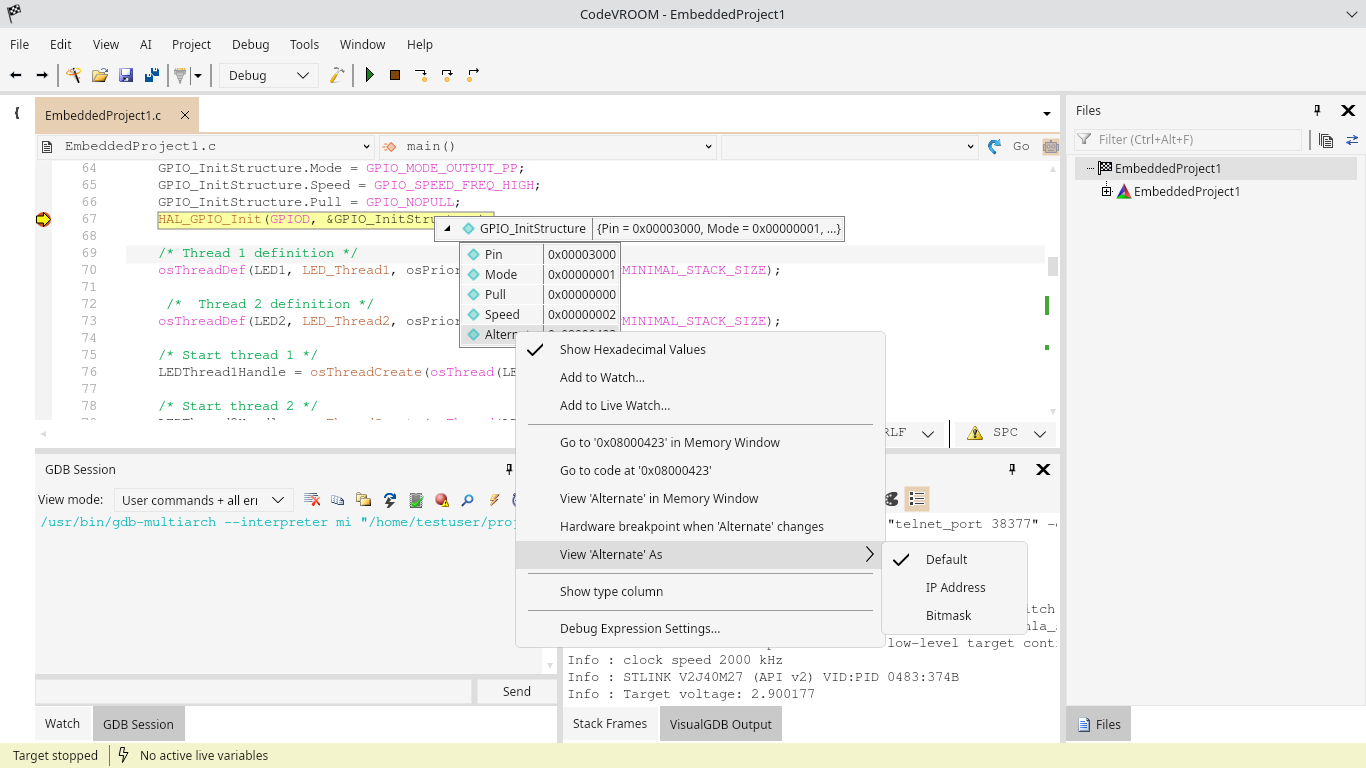 Once the breakpoint hits, you can hover the mouse over different expressions to see the values. You can also customize the primary and the secondary value view (e.g. Binary/Hex or combined) via the Debug Expression Settings command.
 - Resume debugging. Try hovering the mouse over g_Stats. CodeVROOM will show the live values of the fields without stopping the program:
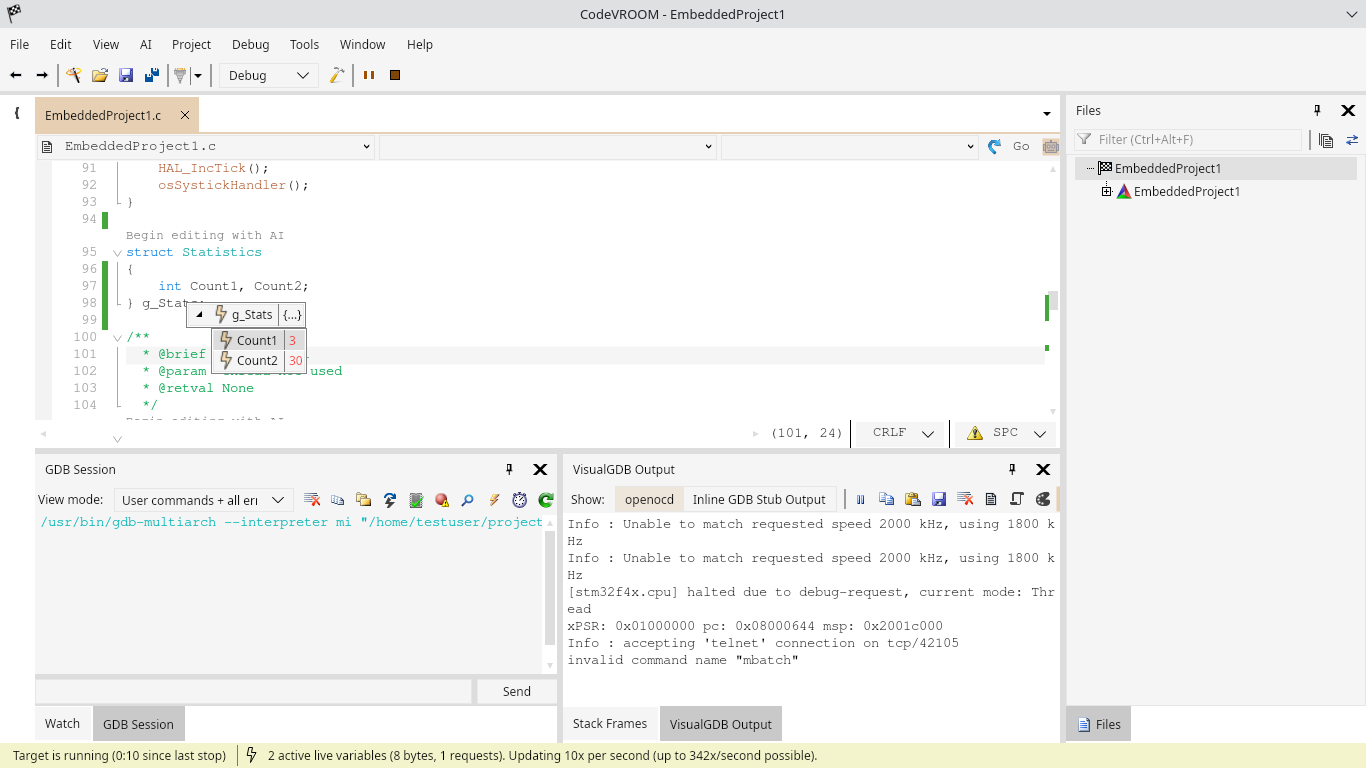 Note that it only works for global variables that can be evaluated without stopping the target. For complex expressions (e.g. type casts), use the dedicated Live Watch window.
 - Use the Debug->Windows->Globals command to open the Globals view:
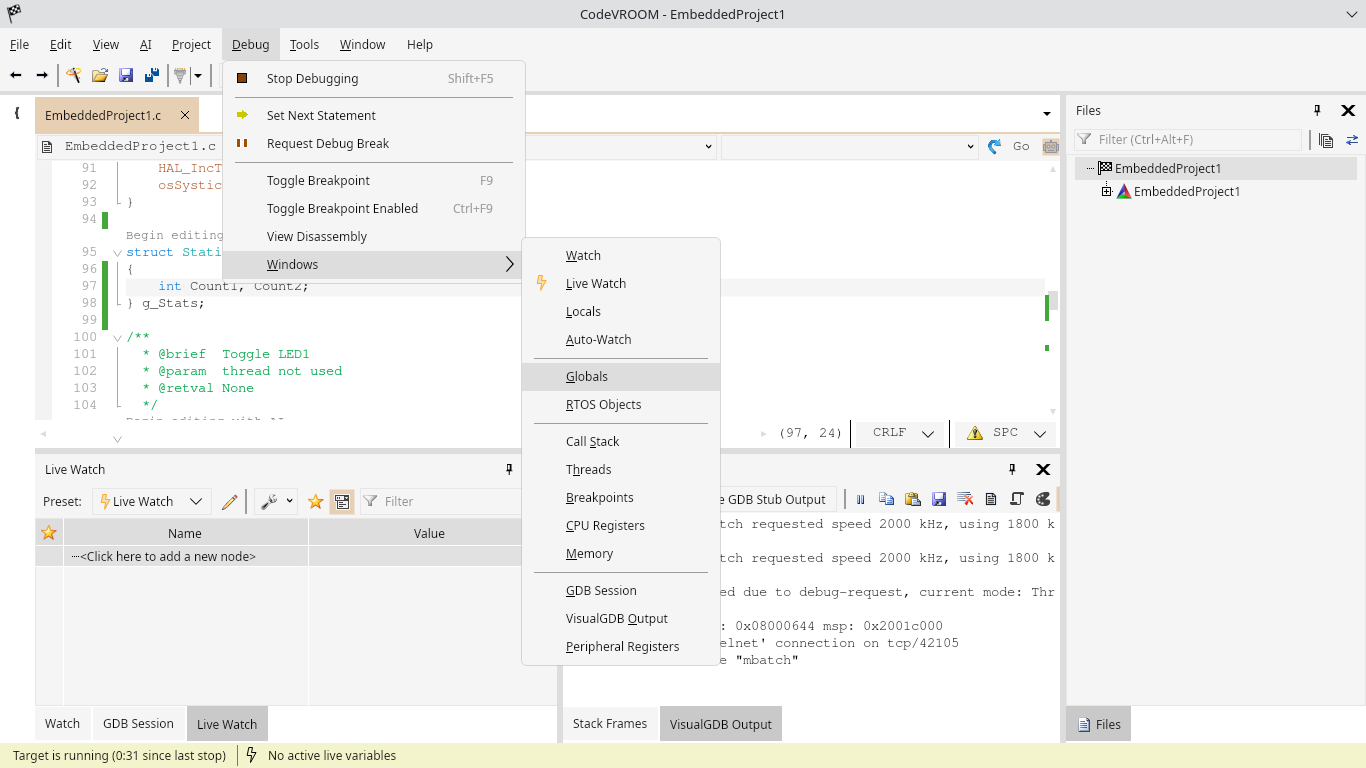
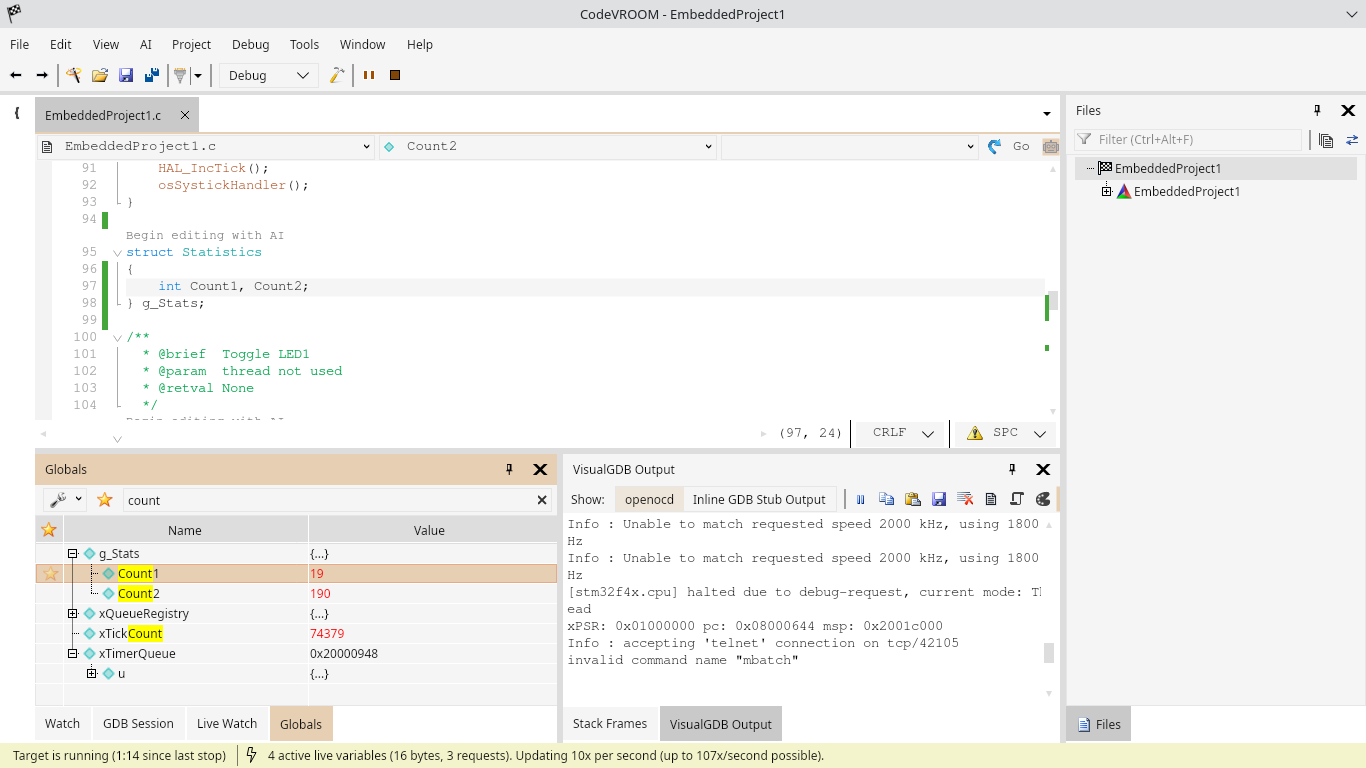
- There you can quickly search for variables containing a particular text. As of v0.6, you need to press Enter to expand the matching nodes, but future versions will support immediate temporary expansion:
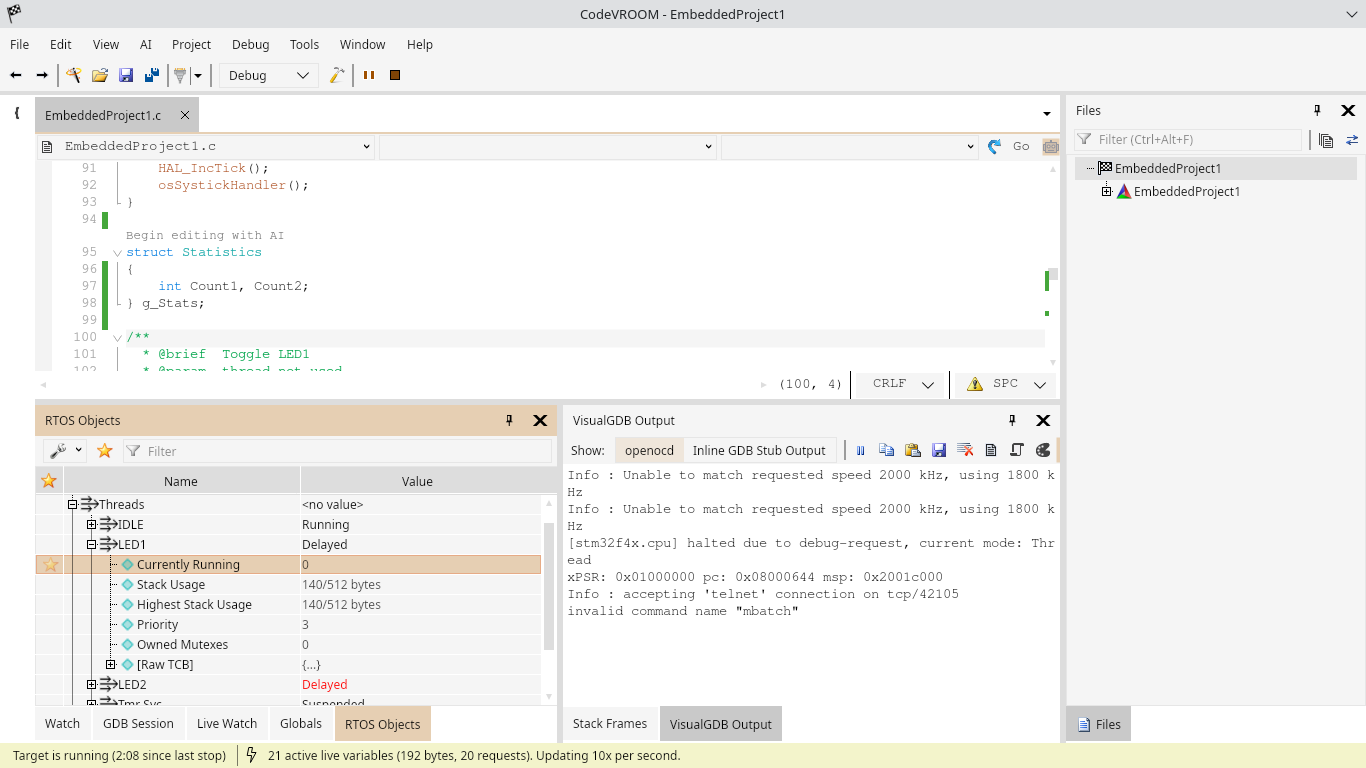
- You can also use the RTOS Objects view to see a live summary of threads, their stack usage, and global status:
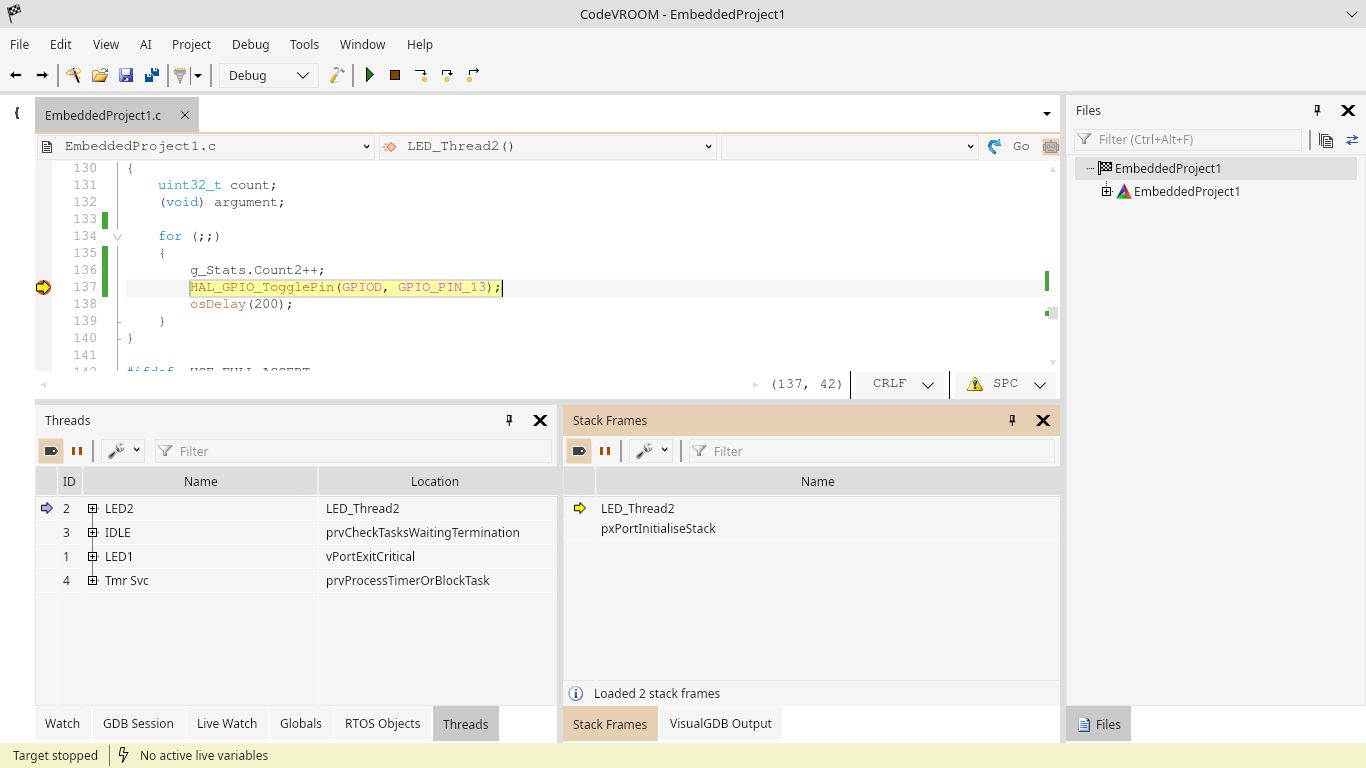
- Set a breakpoint in LED_Thread2 and open the Debug->Windows->Threads window:
- Search for “Thread”. CodeVROOM will immediately highlight the matching frames:
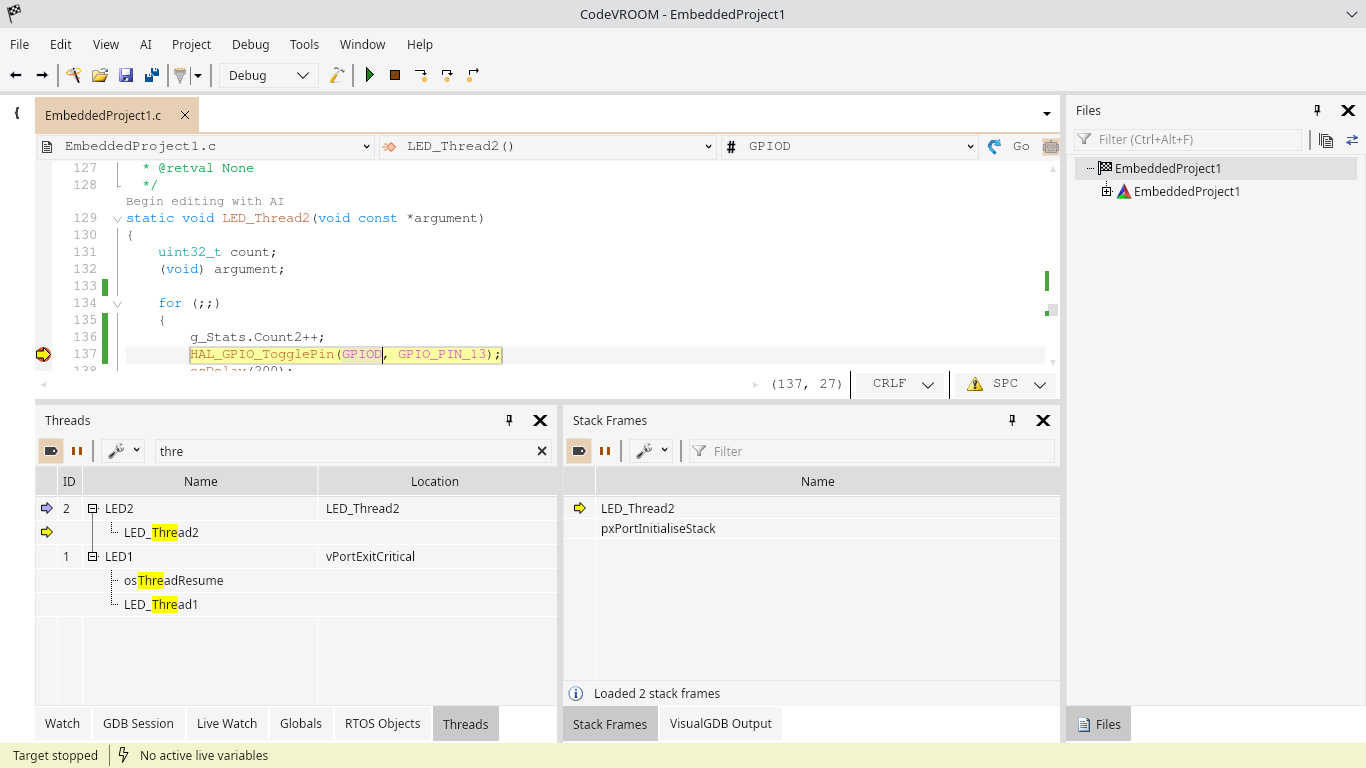
- Once all thread stacks got loaded, CodeVROOM will highlight other thread locations in the code. You can click the links with the thread/frame info to switch to that frame:
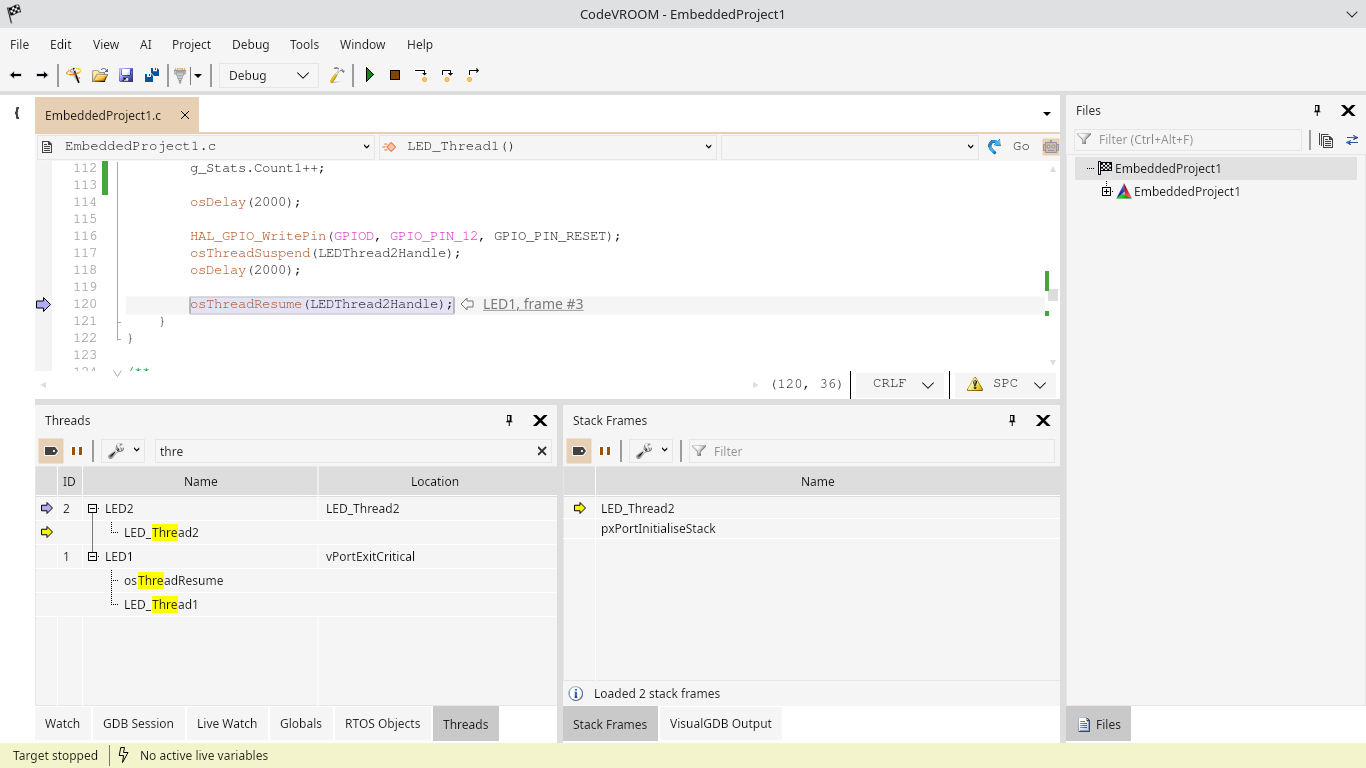 If you used VisualGDB with Visual Studio, you could have noticed that viewing multiple threads/frames slows down stepping. CodeVROOM is designed to completely avoid this bottleneck. Whenever you stop at a breakpoint, it will first show you the location of the stop, and then start loading (and progressively showing) all threads/frames. If you continue execution before all threads got loaded, the background load will get cancelled, and the program will resume immediately.
 - Just like in VisualGDB, you can edit various project properties via the “Properties” command in the Files window:
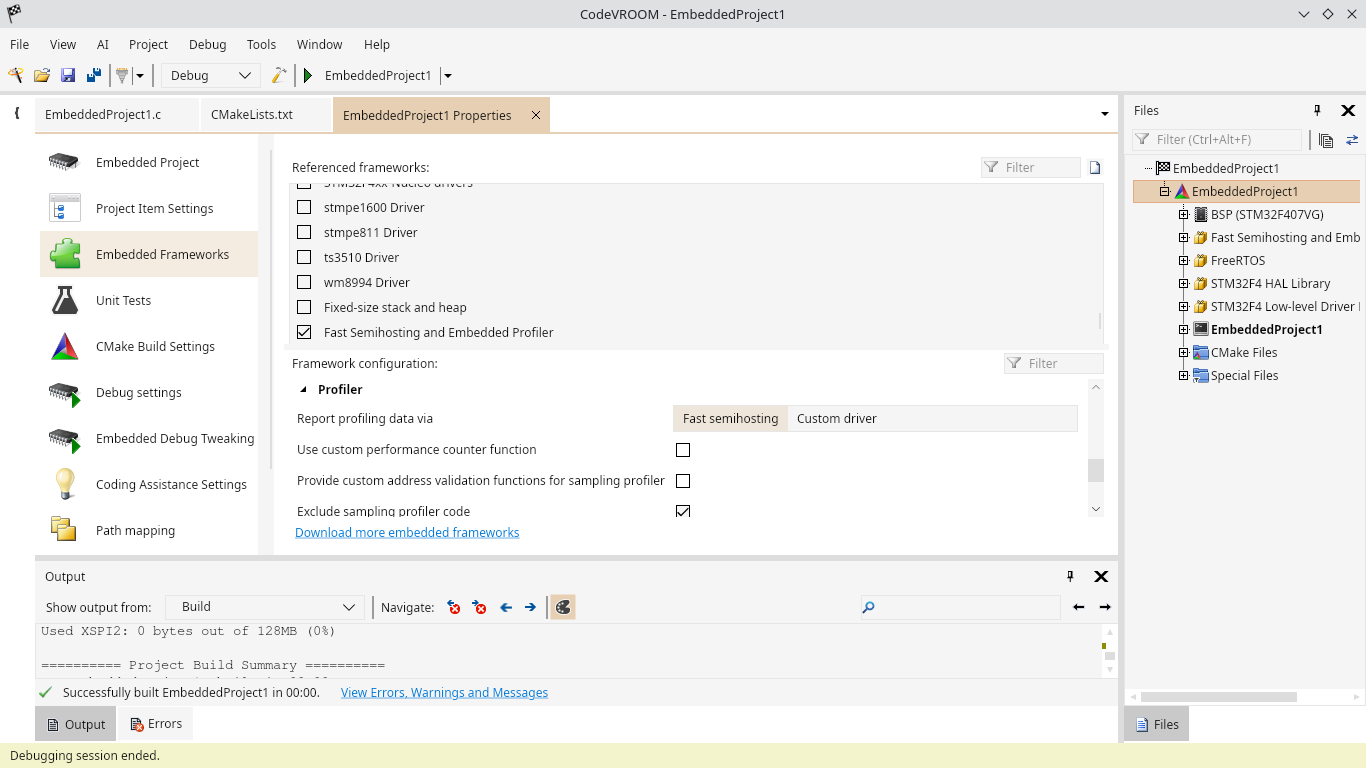 Note that the project, the workspace and the target all have different sets of properties.