Exploring the Linux Kernel using Visual Studio and VisualKernel
This tutorial shows how to use VisualKernel to explore the Linux Kernel source code, visualize the relations between functions using Code Map and step through the code by debugging a simple kernel module. Before you begin, download and install VisualKernel 2.0. If you don’t have Visual Studio installed, you can try out the free Visual Studio Community Edition. VisualKernel provides the debugging support and includes the Clang-based IntelliSense engine that parses the kernel source code and delivers features like Code Map.
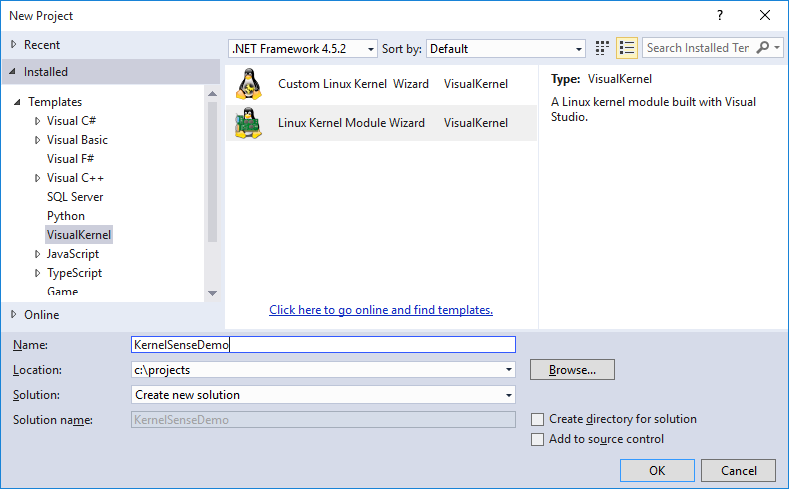
- Start Visual Studio. Select File->New->Project and pick the VisualKernel kernel module wizard:
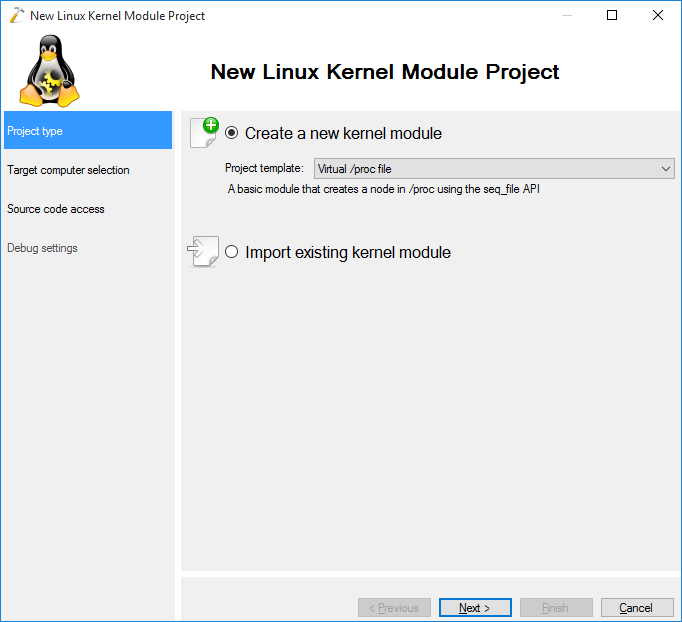
- Select “Virtual /proc file” in the “Project Template” field:
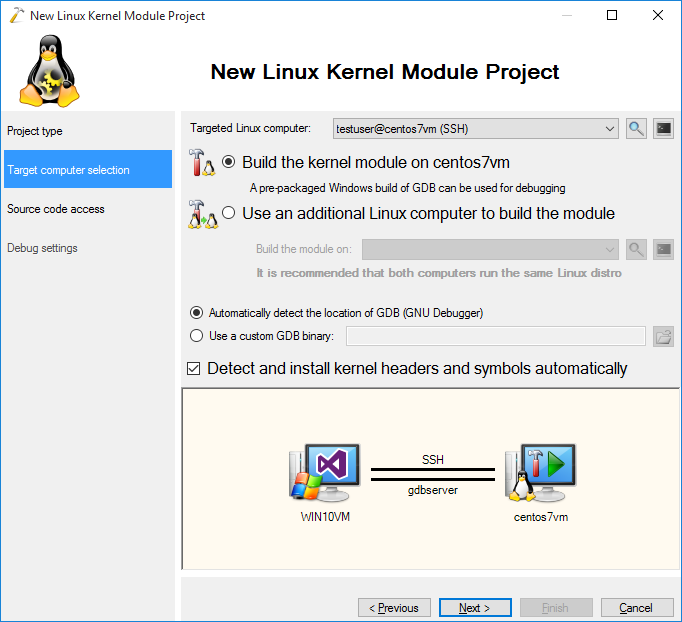
- On the next page select the Linux machine you would like to target and press “Next”:
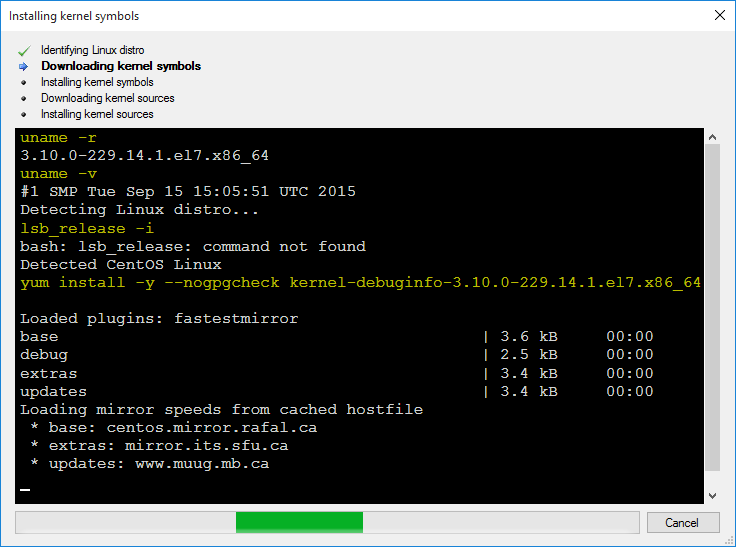
- VisualKernel will automatically download the necessary source and symbol packages and cache the relevant files on the Windows machine:
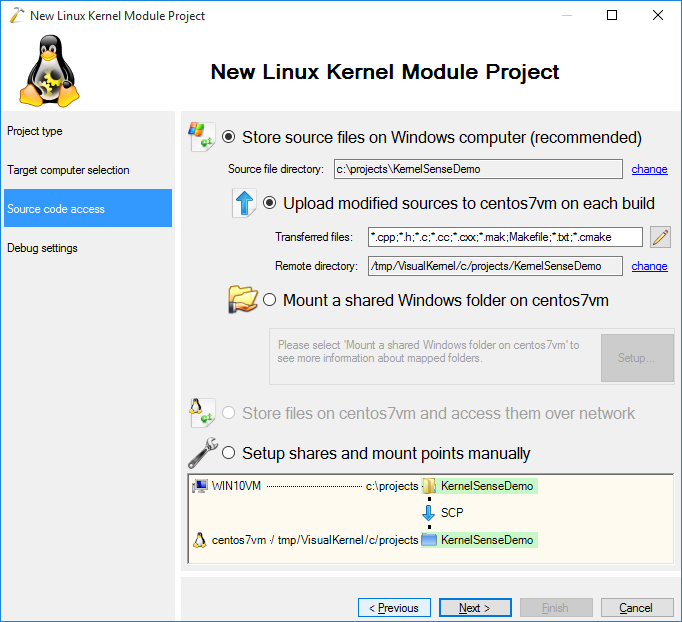
- The next page allows specifying the location of the source files for your module. Proceed with the default location:
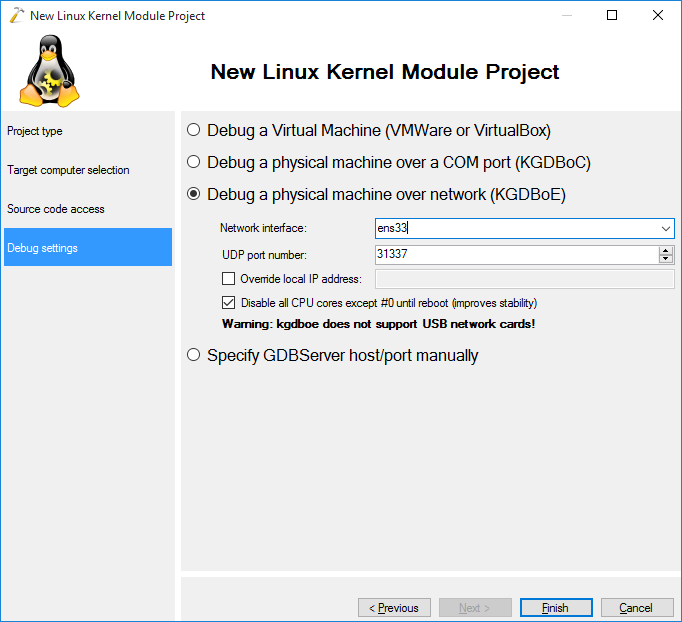
- On the last page of the wizard select the debug method you want to use. You can debug your kernel via network if your network card driver supports the netpoll interface. Otherwise you can debug your machine via a COM port, VM debugger, or using JTAG with an external tool like OpenOCD:
- Press “Finish” to have your project created. You can build it by pressing Ctrl-Shift-B:
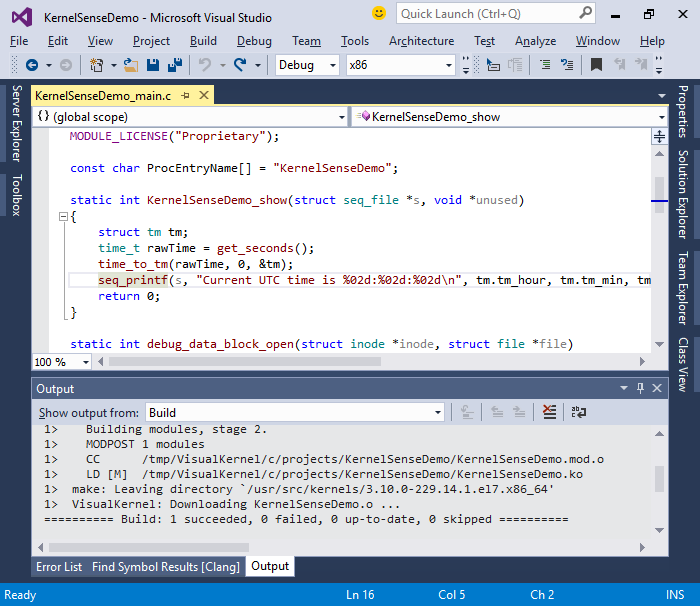
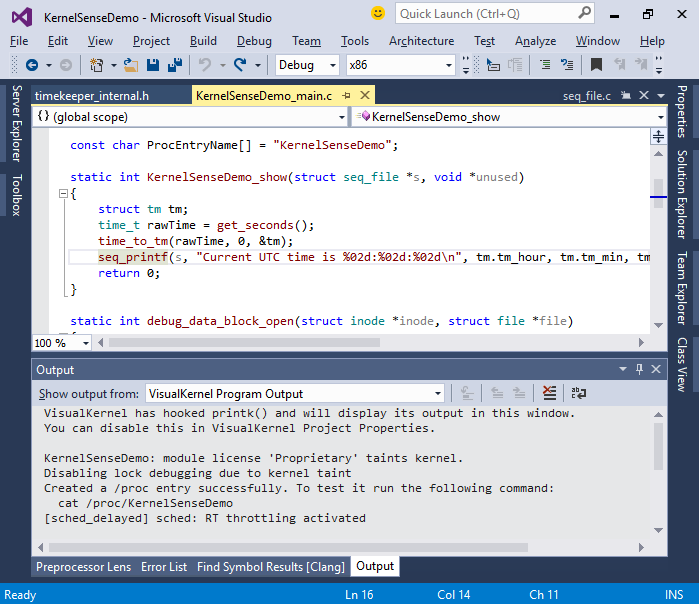
- When the build completes, you can start debugging by pressing F5. The sample module will display a hint on trying it out in the kernel output window:
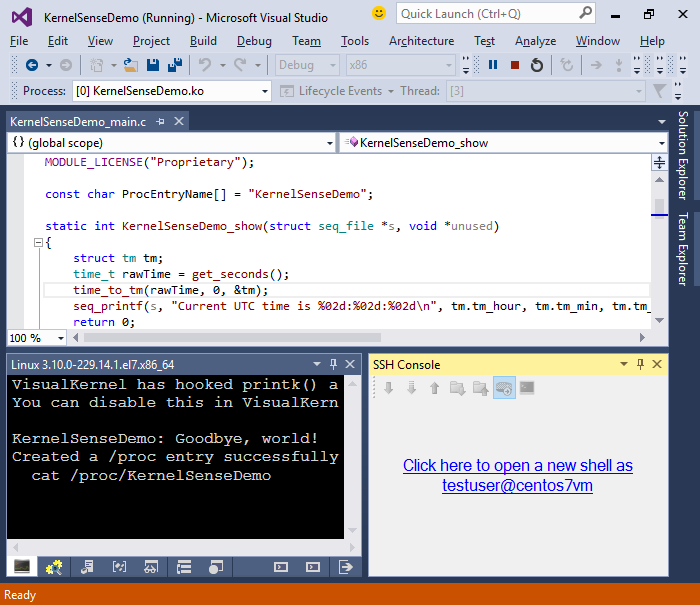
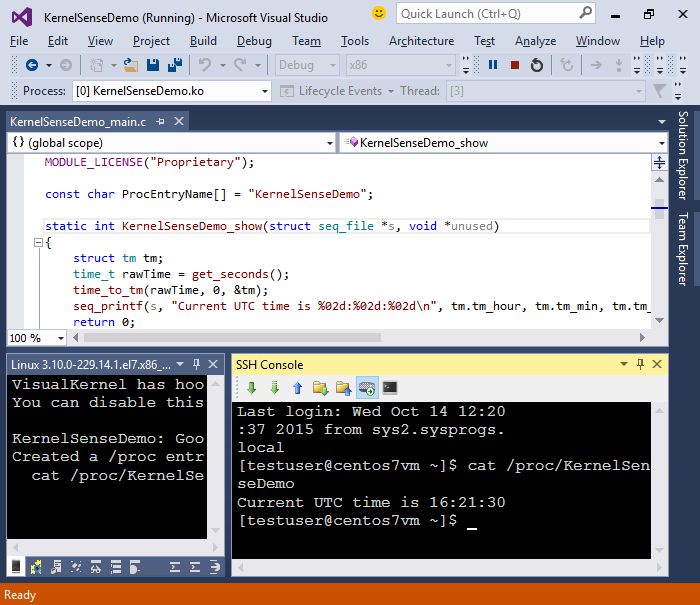
- Open the Debug->Windows->SSH Console window, open a new SSH shell and run “cat /proc/<module name>” to see the output generated by the module:
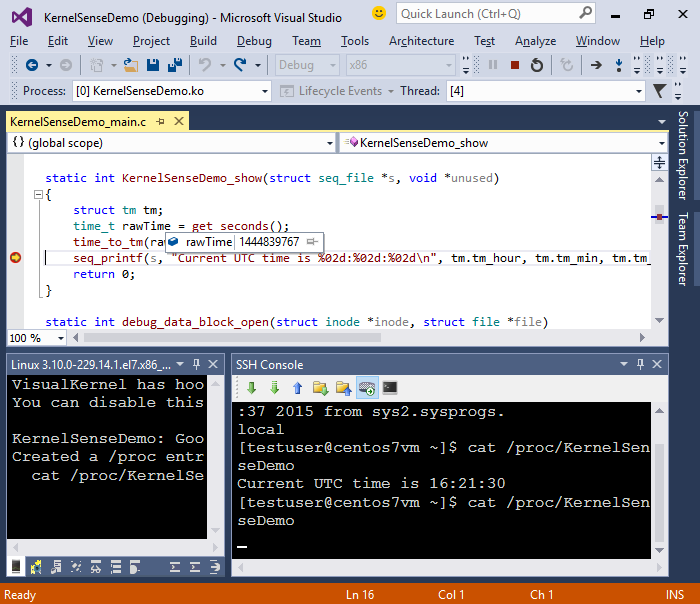
- Now we will step through the code that prints this message. Set a breakpoint on the call to seq_printf() and re-run the “cat” command:
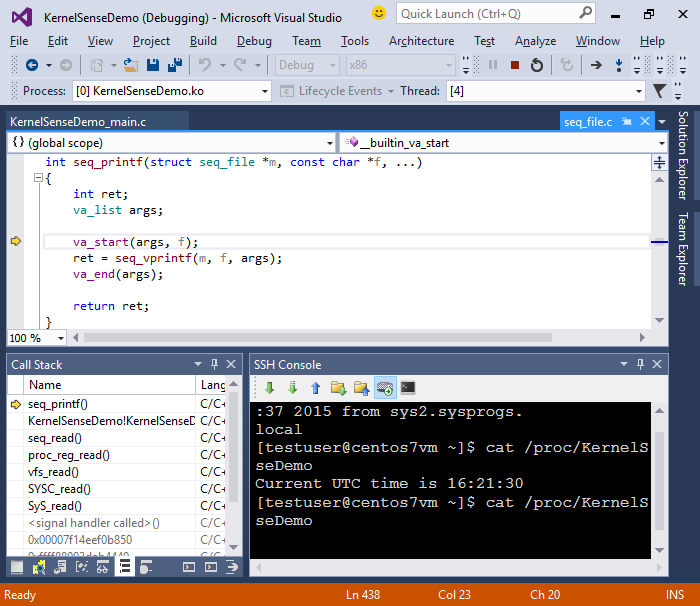
- Step into the seq_printf() function by pressing F11:
- Resume debugging to see the output in the SSH Console window and then press Shift-F5 to automatically unload your module and detach from the kernel. The output from the last session will be shown in the VisualKernel Program Output section of the Output pane:
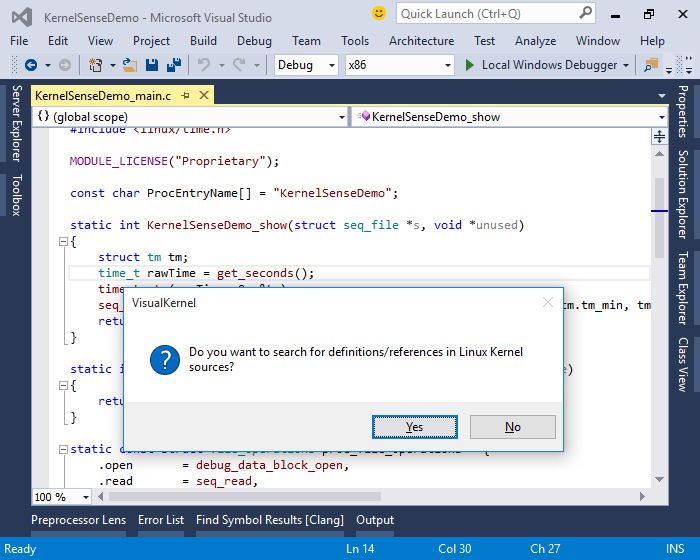
- Now we will use the Clang-based IntelliSense engine provided by VisualKernel to quickly find function definitions and visualize relations between functions. Click on the call to get_seconds() and press F12 to go to the function definition. VisualKernel will ask whether you want to index the kernel source code:
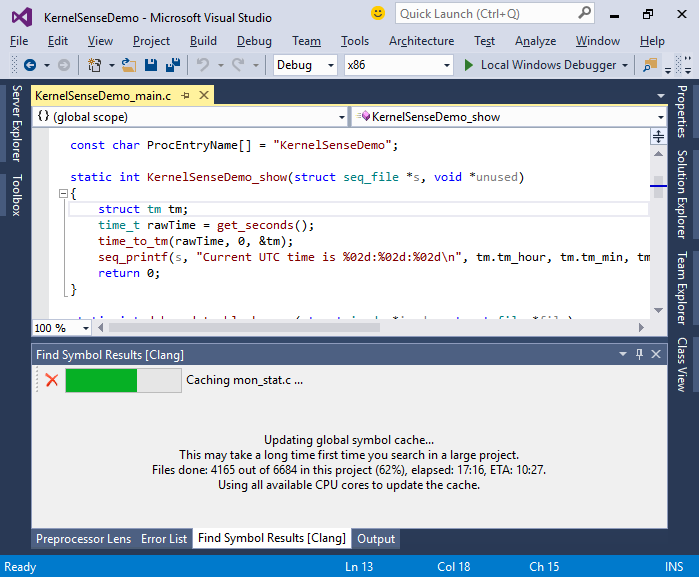
- Choose “Yes”. VisualKernel will begin indexing the kernel source. The first pass will take 15-30 minutes depending on your machine speed, but once the index file is created, all searches will be almost instant:
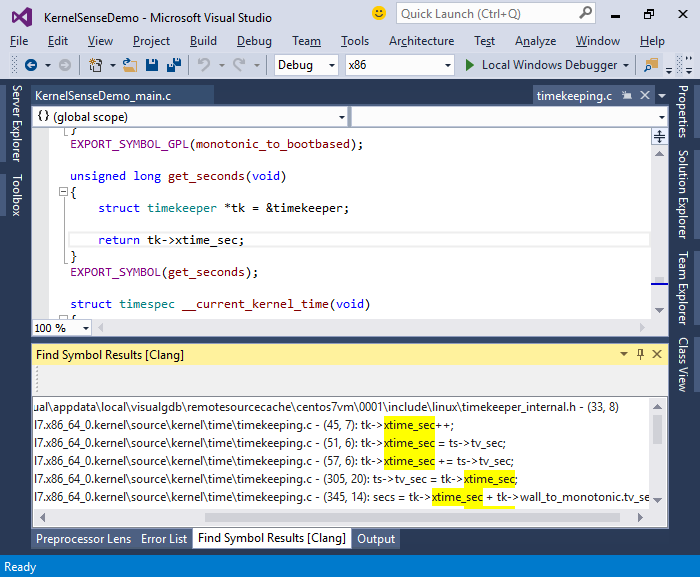
- When the implementation of get_seconds() opens, right-click on the xtime_sec field and select “Find all references”:
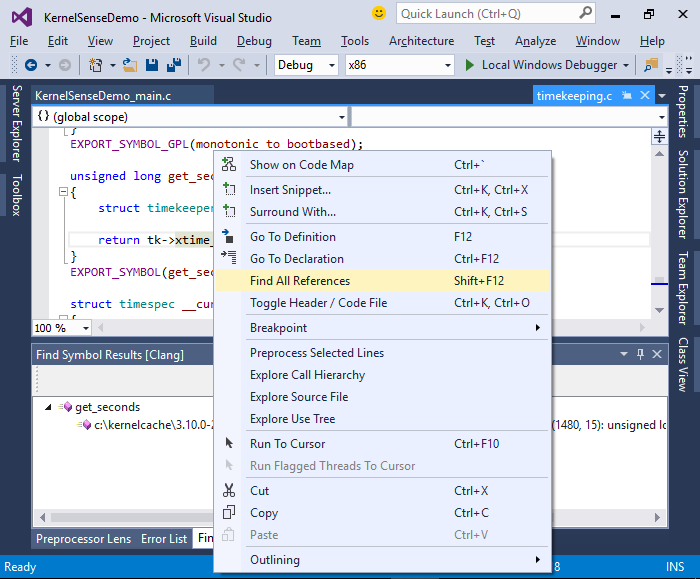
- VisualKernel will quickly display all references to timekeeper::xtime_sec. It uses a precise reference finding mechanism that will not confuse it with other fields with the same name and will also correclty look into the preprocessor macros:
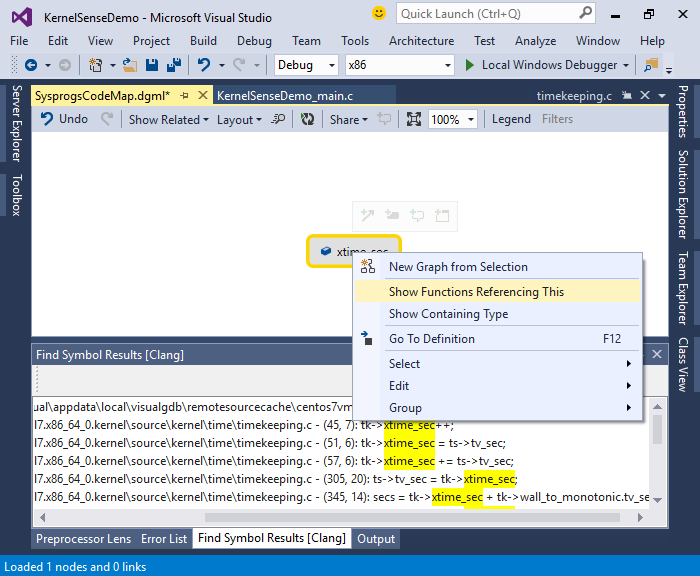
- You can get a good visual overview of the function working with the xtime_sec field via Code Map. Right-click on xtime_sec and choose “Show on code map”. Then right-click on it and select “Show Functions Referencing This”:
- VisualKernel will show the related functions graphically, also visualizing the calls between them:
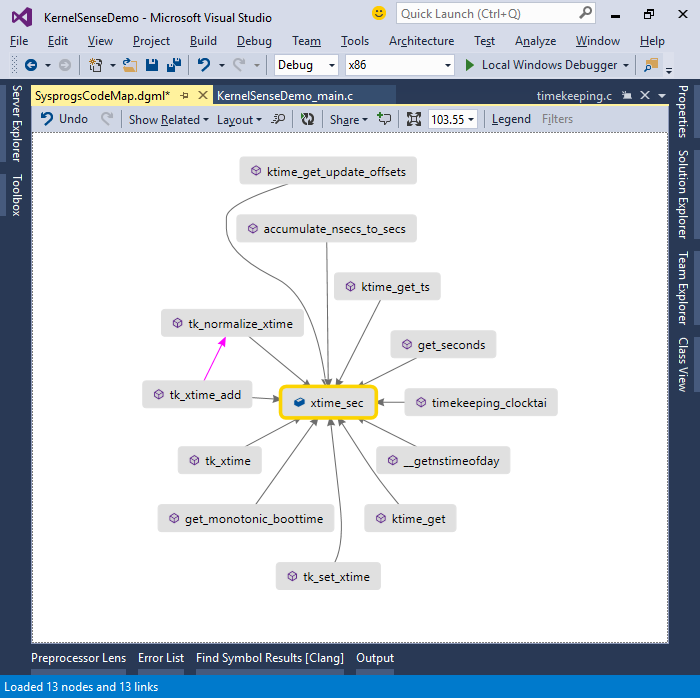 You can double-click on any of the functions to open its source code or right-click to view functions calling them, functions called by them, or related variables and fields. Double-click on xt_time_add() to open its definition:
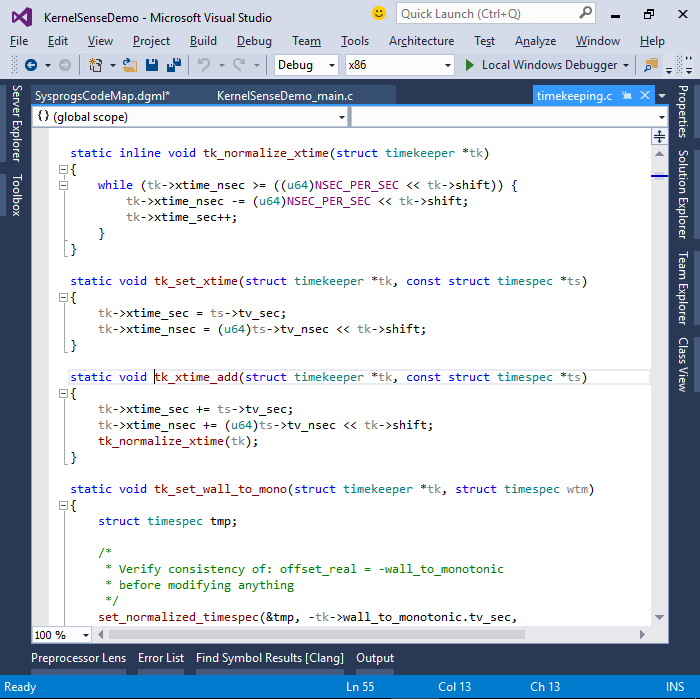
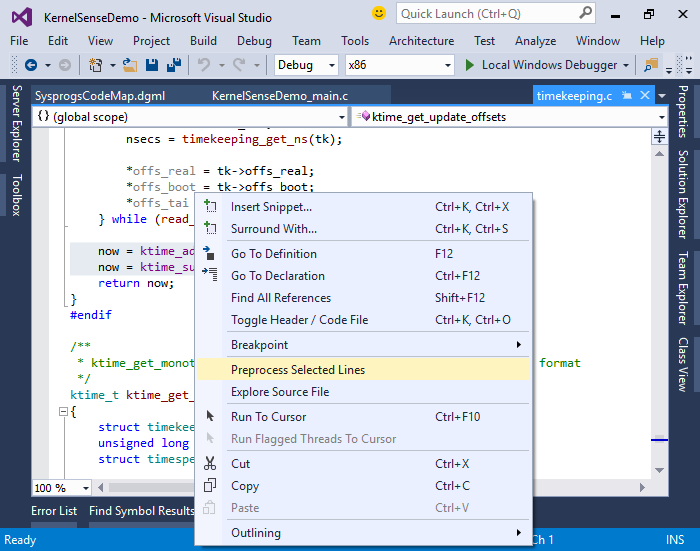
- A lot of Linux kernel code uses various preprocessor macros that can be non-trivial to understand. You can use the Preprocessor Lens provided by VisualKernel to automatically expand those macros. E.g. select the lines containing uses of the ktime_add_ns() and ktime_sub() macros, right-click and select “Preprocess Selected Lines”:
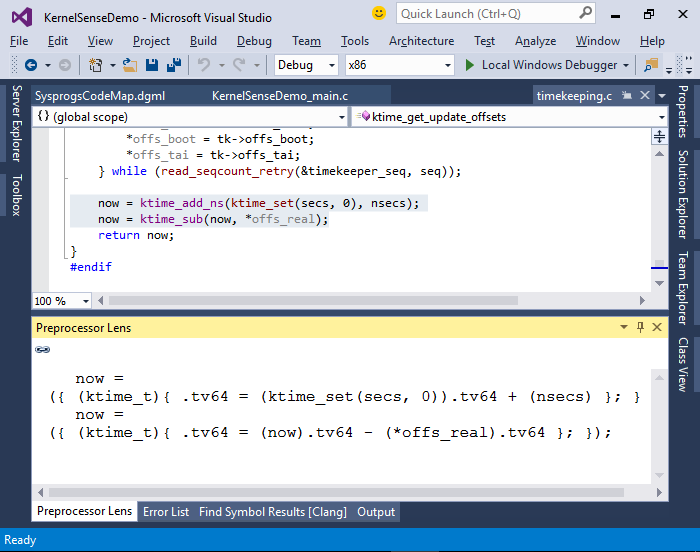
- VisualKernel will expand the preprocessor macros and show the result in the Preprocessor Lens window:
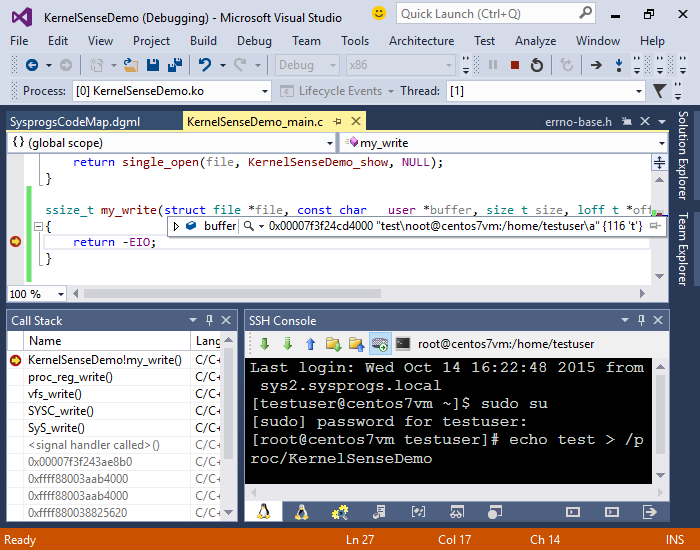
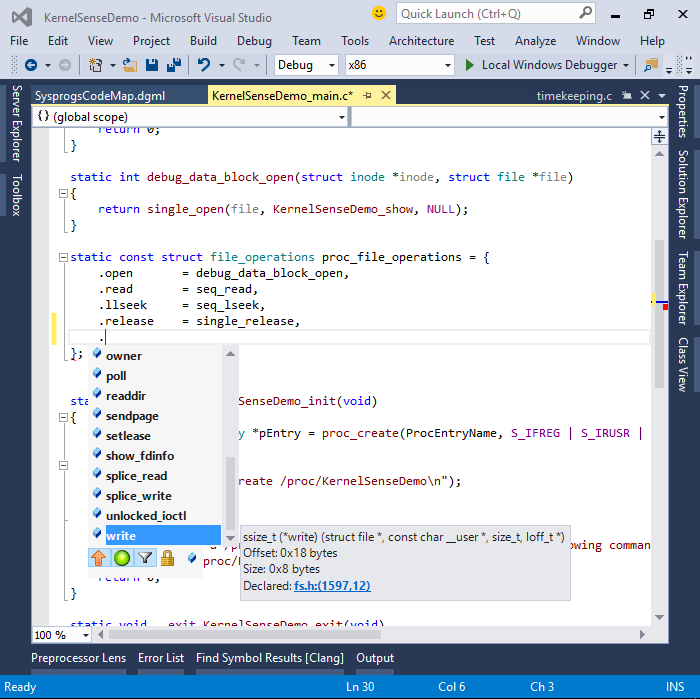
- You can also experiment with the kernel by modifying your kernel module. E.g. you can add the .write handler to proc_file_operations.
ssize_t my_write(struct file *file, const char __user *buffer,
size_t size, loff_t *off)
{
return -EIO;
}Clang-based IntelliSense will fully understand the GNU C extensions like the designated initializers:
- Now you can build and load the module by pressing F5, open the SSH console and try writing to the virtual file under /proc:
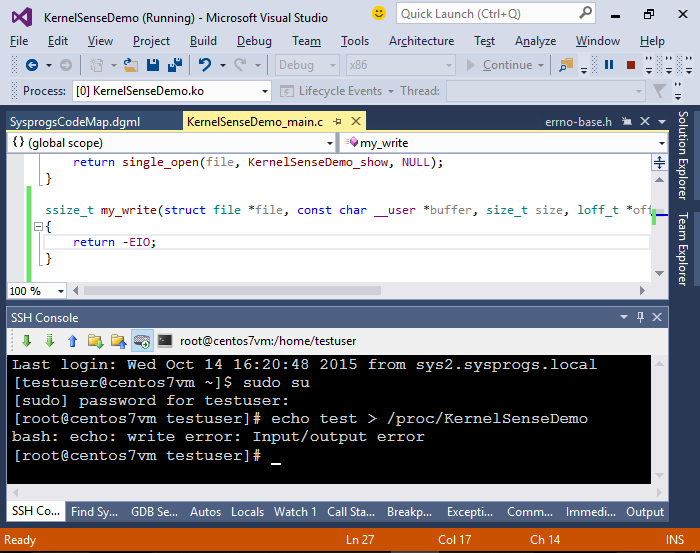 The “Input/output error” message matches the EIO code returned by my_write().
 - Note that if you are using KGDB-over-Ethernet (KGDBoE) as your debug transport, setting breakpoints in some code related to the network and the I/O subsystem will hang the debugging session. This happens if a breakpoint is hit while the code is holding some shared resources that are needed by the network driver to send packets to GDB. Setting a breakpoint in my_write() is one example of that. If you need to step through such functions, open VisualKernel Project Properties and switch to a more reliable VM debug mechanism or a slower COM port-based one:
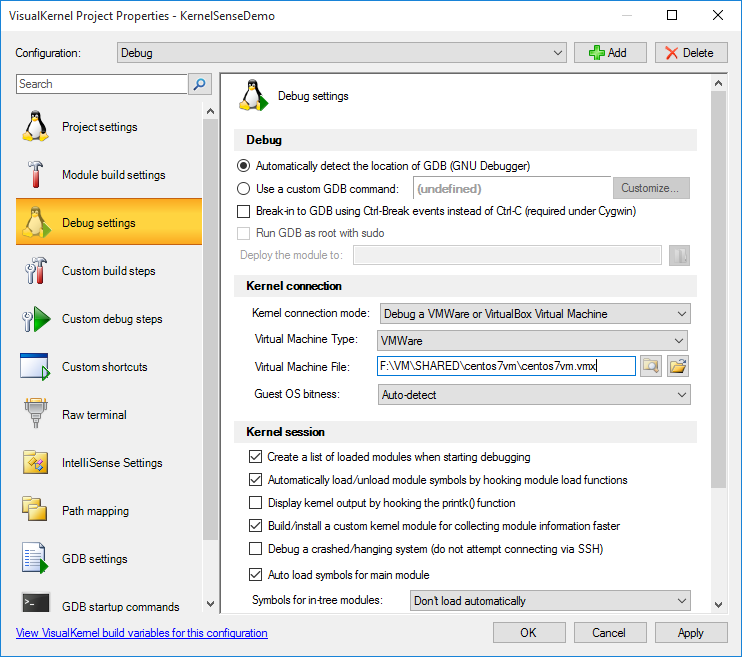
- Then you will be able to debug code that runs with the locks held, such as the write() handler for files under /proc: