Using Code Explorer to Navigate the Linux Kernel
This tutorial shows how to use Code Explorer to conveniently navigate the Linux kernel source using VisualKernel.
We will create a basic kernel module that creates a file in /proc and implements the callback functions required by the proc_create() API. We will then use the Code Explorer to quickly find other implementations of similar callbacks, and also understand the context where they are used.
Before you begin, install Visual Studio and VisualKernel 4.0 or later.
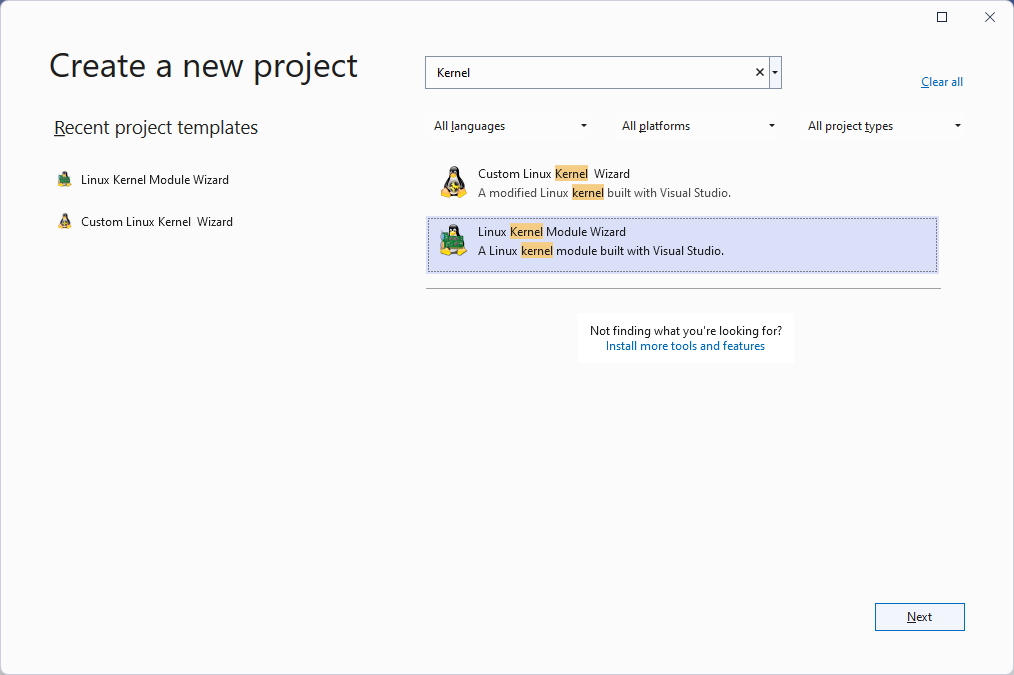
- Start Visual Studio and locate the VisualKernel Linux Kernel Module Project Wizard:
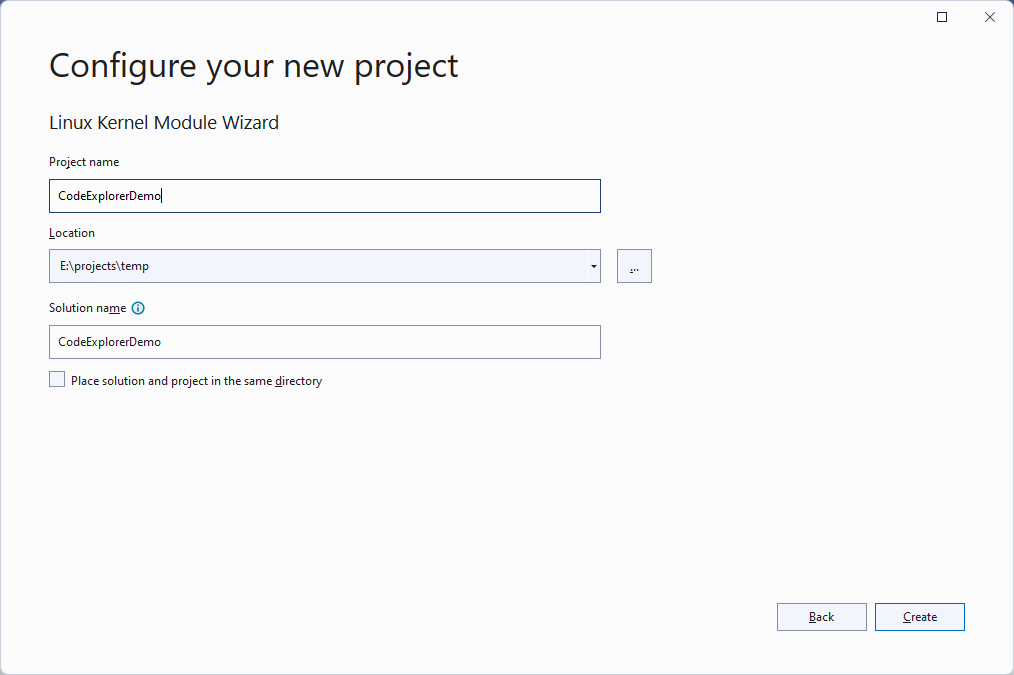
- Enter the name and location for your project:
- In this tutorial we will use the project template for the /proc file, however any other template will work as well:

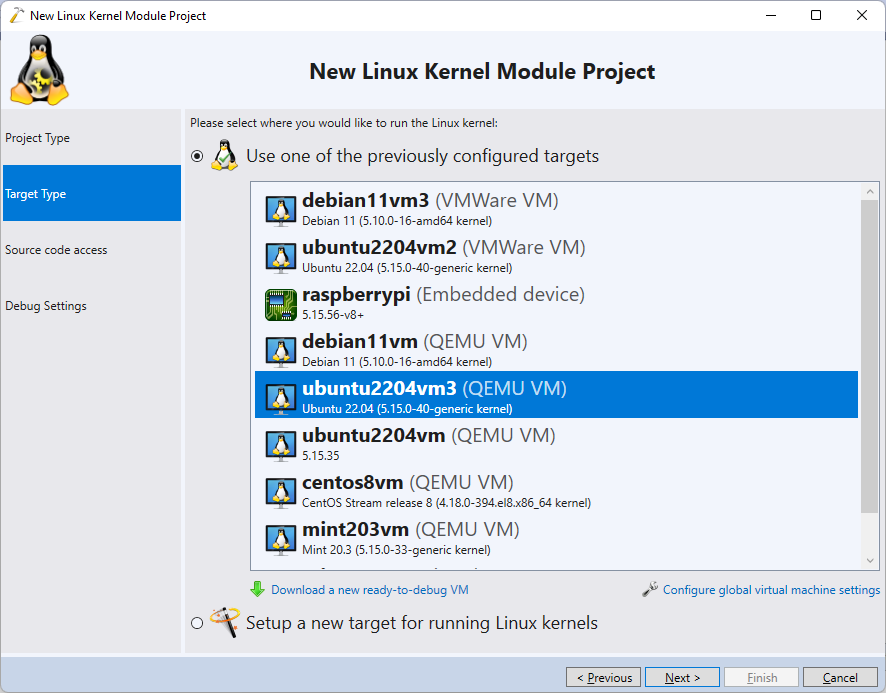
- Pick the target system where you would like to run the module. In this tutorial we will use a pre-built Ubuntu 22.04 VM, however you can configure VisualKernel to target any other supported VM or a physical machine:
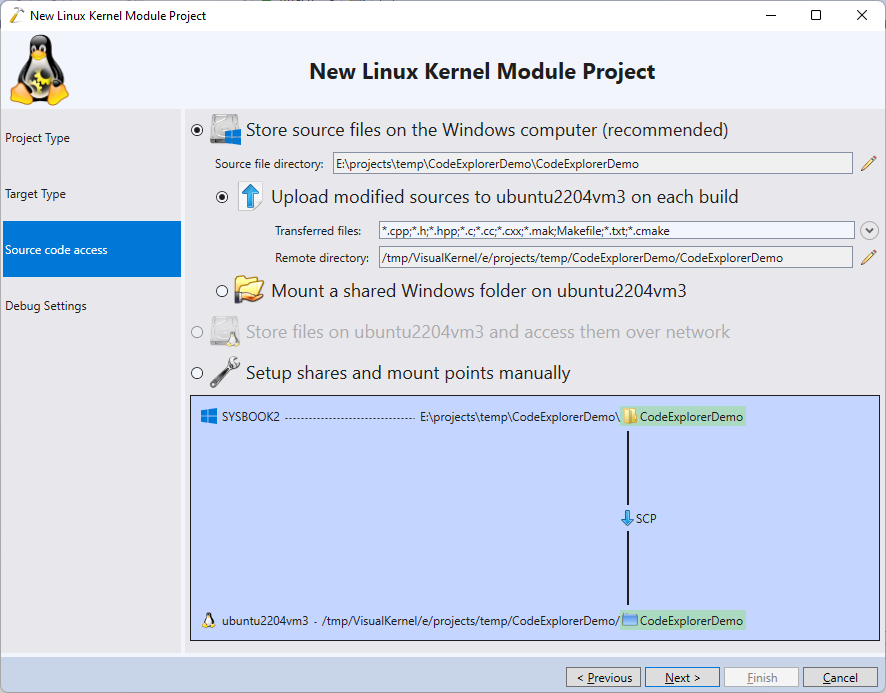
- VisualKernel will suggest storing the source files for the module on the Windows machine and uploading them during build. Proceed with the suggested settings:
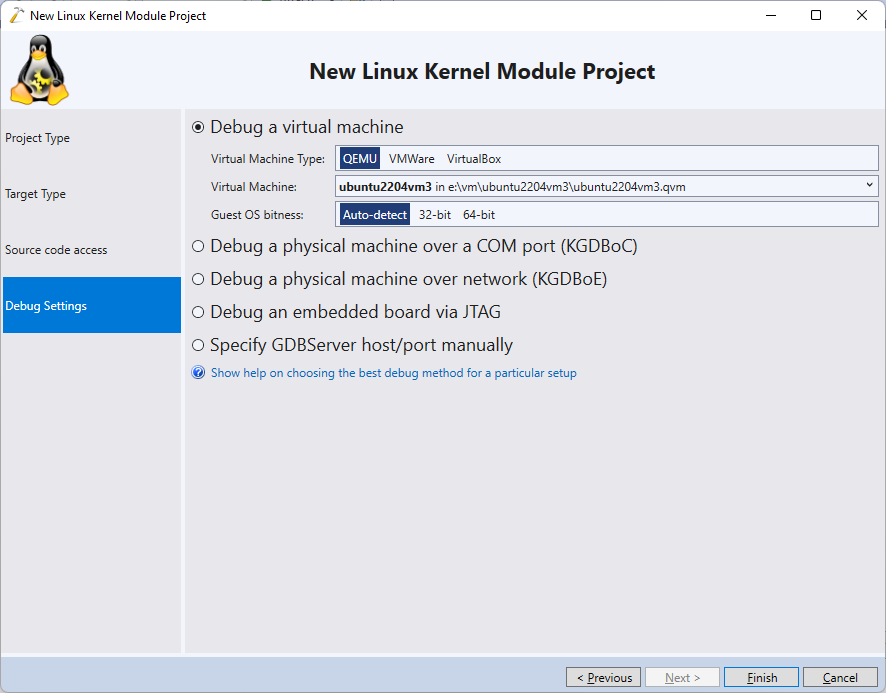
- Select the debug settings that match your target and click “Finish” to generate a project:
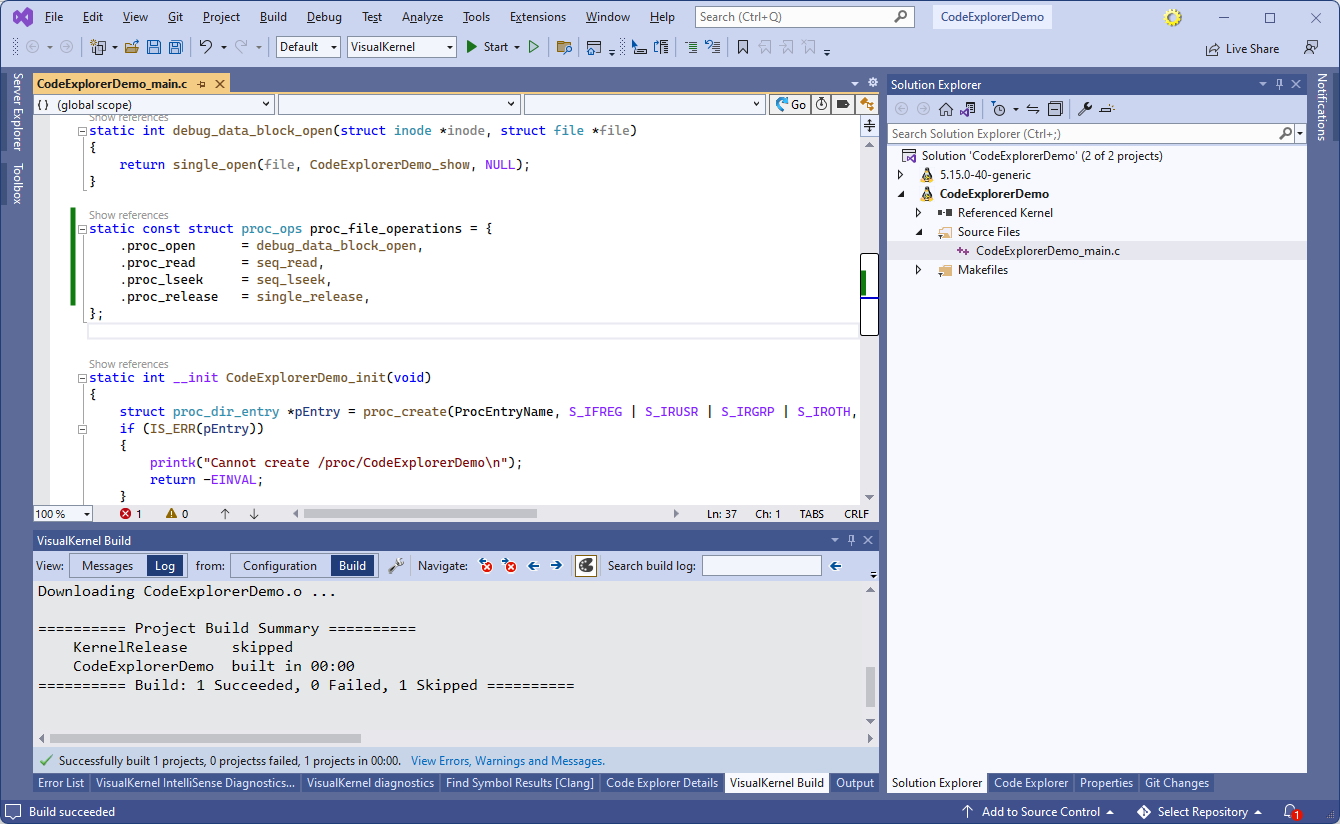
- Once the project is created, you can build it using the Build->Build Solution command. Depending on the kernel version you are using, you may need to replace the proc_ops structure with file_operations:
- Set a breakpoint in the init() function and press F5 to begin debugging. The breakpoint will trigger, allowing you to step through the code:
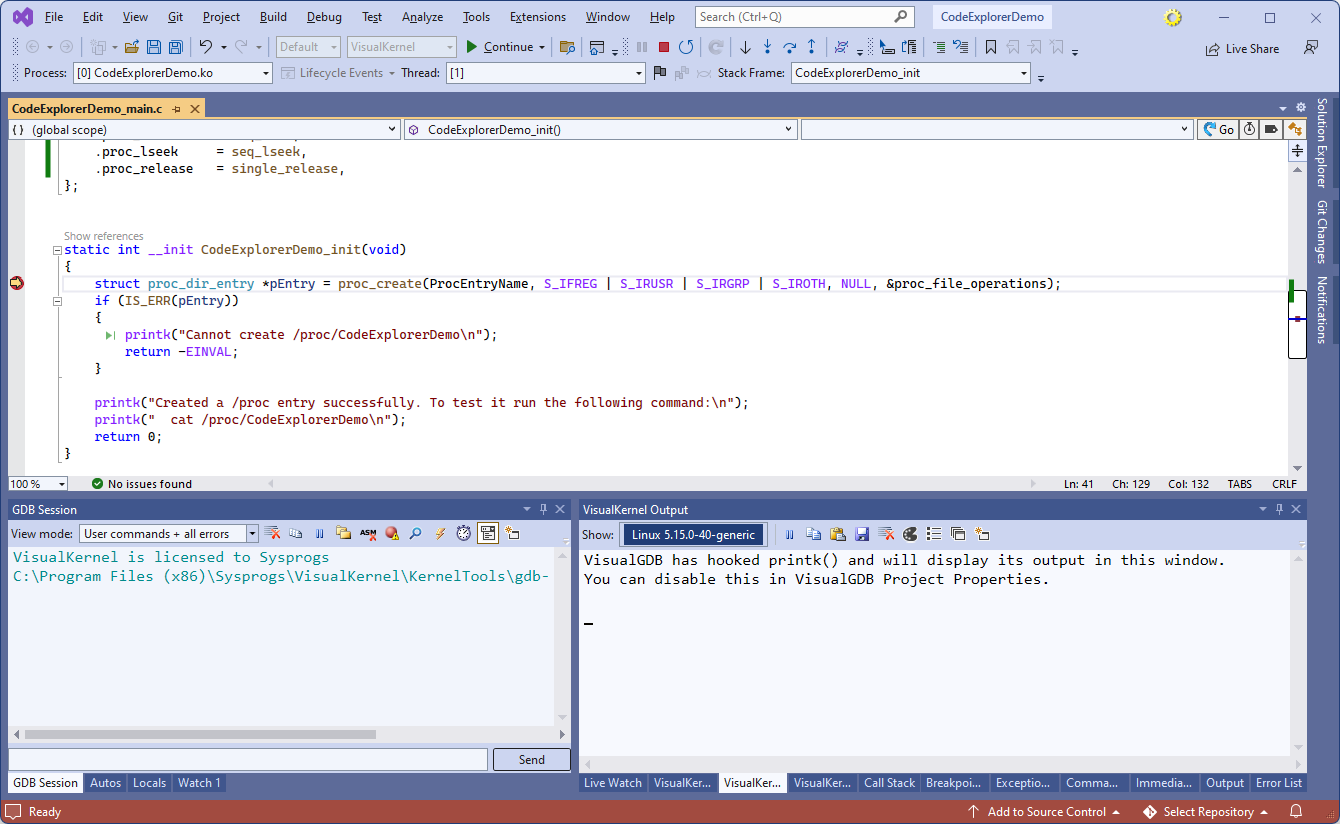
- Press F5 to continue debugging. We will now test the created proc file by opening an SSH window connecting to the target:

- Run the “sudo cat /proc/<Project Name>” command and make sure that the output shows the current time:

- While the debugger could be useful in understanding how this particular example works, it requires physically stepping through every relevant scenario, which could be slow. Static analysis tools like Code Explorer, on the other hand, allow quickly navigating the kernel code without having to step through it. Before we demonstrate it, make sure that the kernel sources are shown in the Solution Explorer:
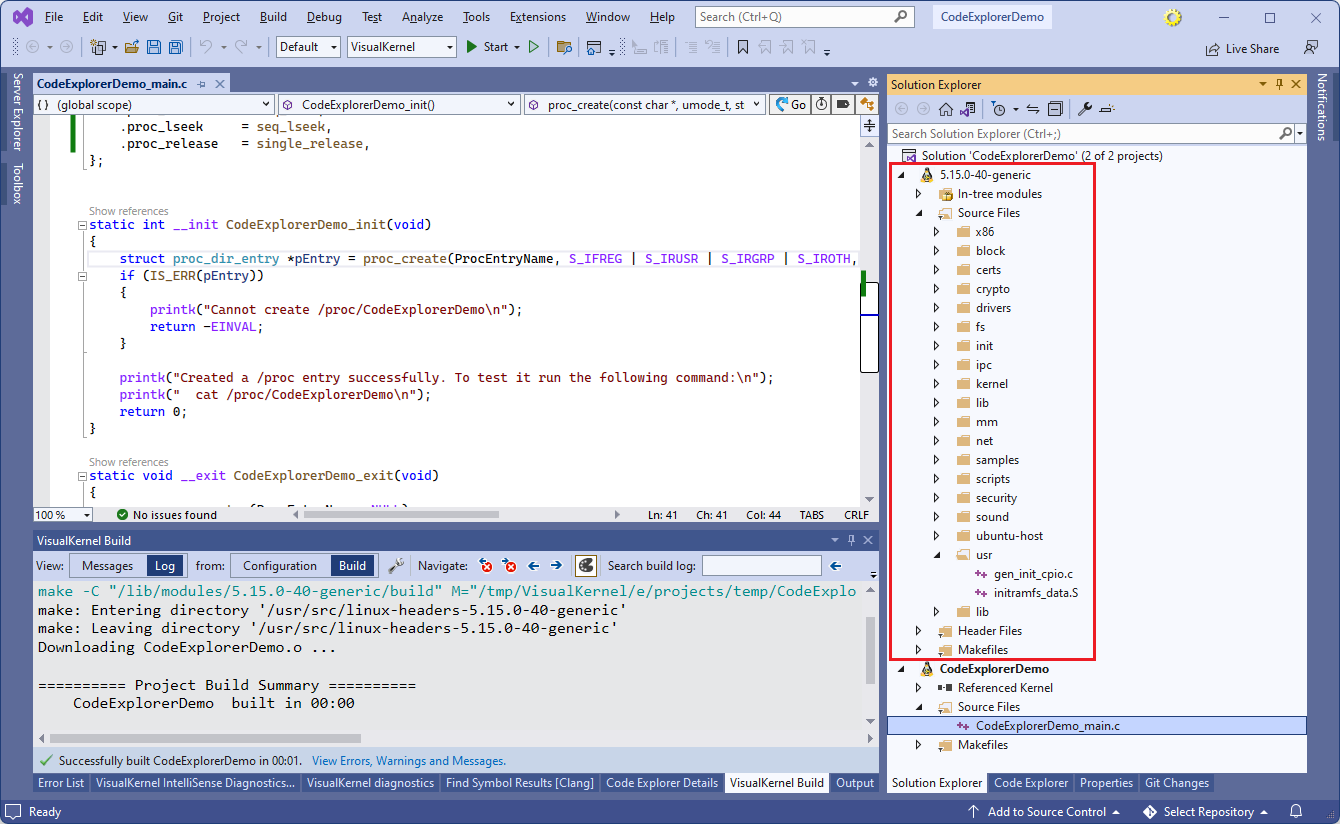 If not, locate the kernel reference under the “Referenced Kernel” node inside the project, and double-click on it to load the sources.
 - Go to the initialization of the proc_lseek field in the main file and click the “Go to Code Explorer” button in the top right corner of the text editor:
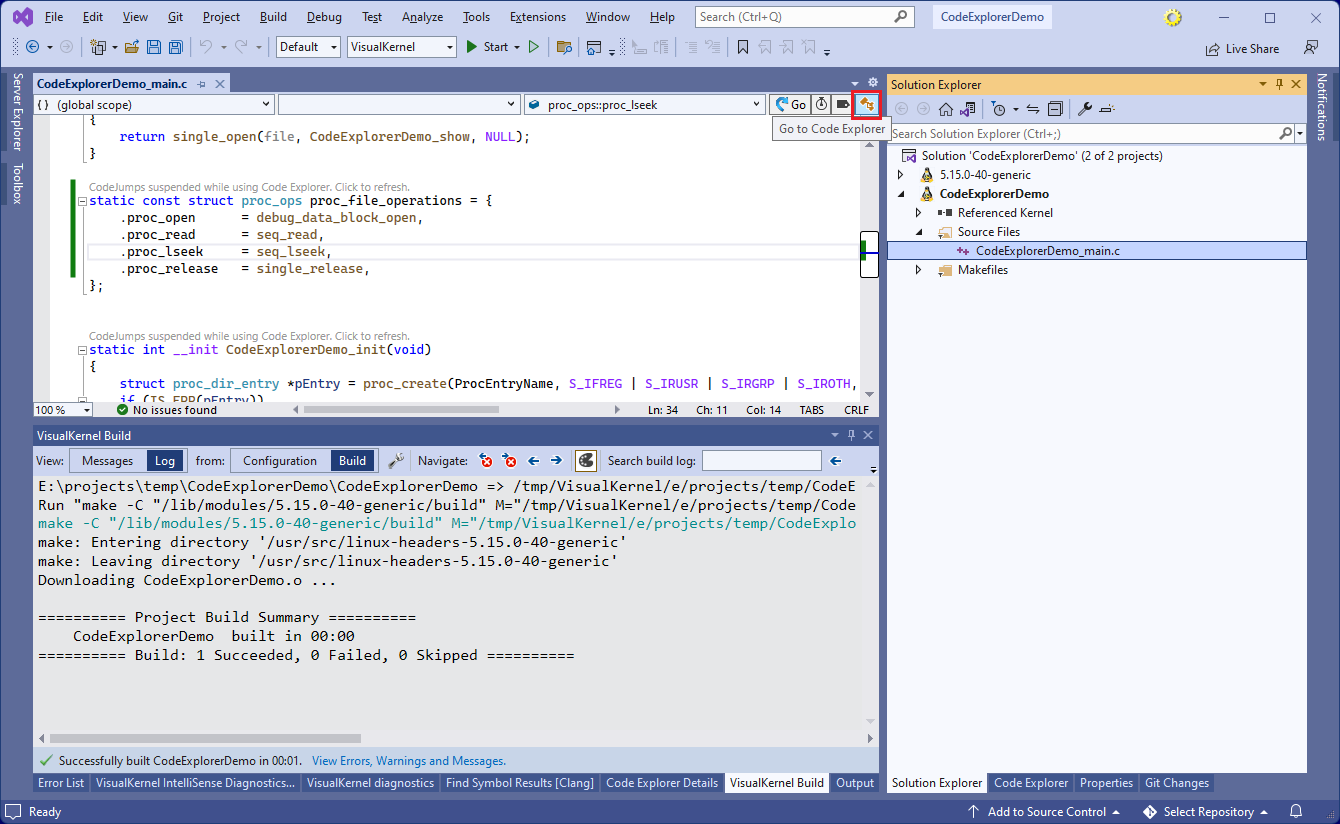
- Click the Show Details button in the Code Explorer window to show the details view at the bottom:
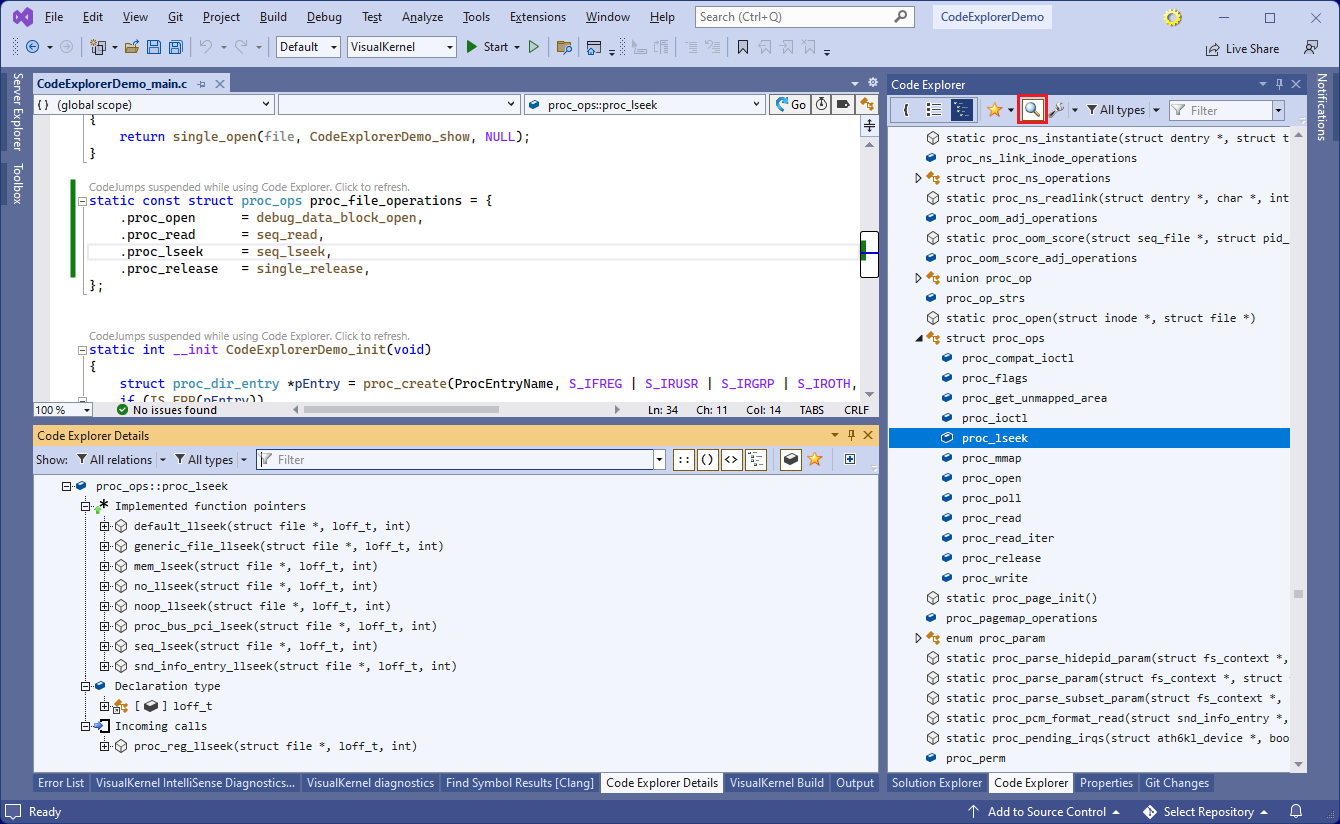 Note how the Code Explorer Details view shows:
- All functions throughout the kernel sources, “implementing” the proc_lseek field (i.e. functions that are ever assigned to that field).
- The functions “calling” the field (i.e. calling the function pointed by the field)
- The type returned by the function
- You can quickly navigate the detail tree to find out that:
- The proc_ops::proc_lseek field is ‘called’ by the proc_reg_llseek() function.
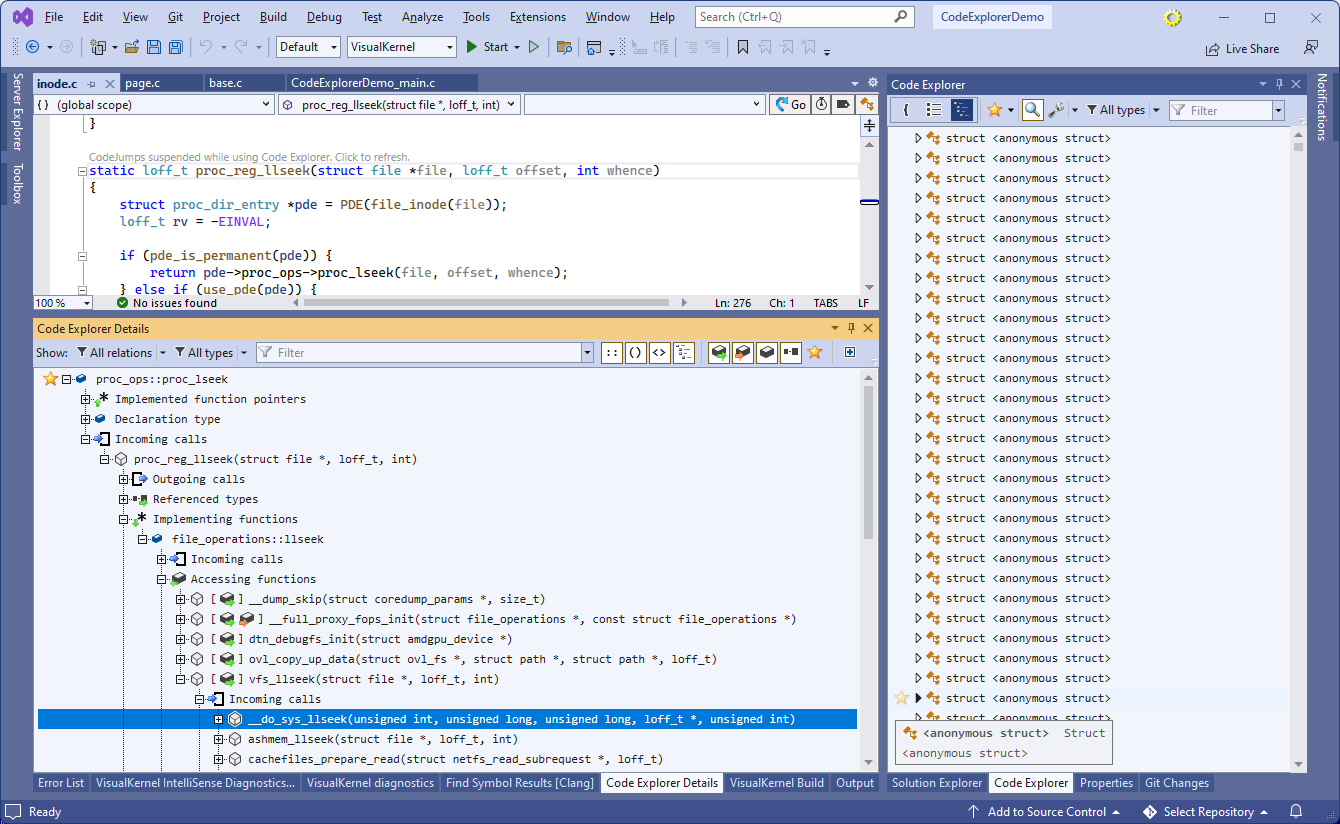
- The proc_reg_llseek() function is indeed assigned to the file_operations::llseek field.
- The file_operations::llseek() field is access by multiple functions, particularly by vfs_llseek().
- The vfs_llseek() is called by __do_sys_llseek() that implements the llseek system call.
The Code Explorer relies on a heavily optimized code database generated by the VisualKernel’s Clang IntelliSense engine and can find those relations almost instantly once the kernel has been indexed (or if you are using a pre-indexed kernel image).
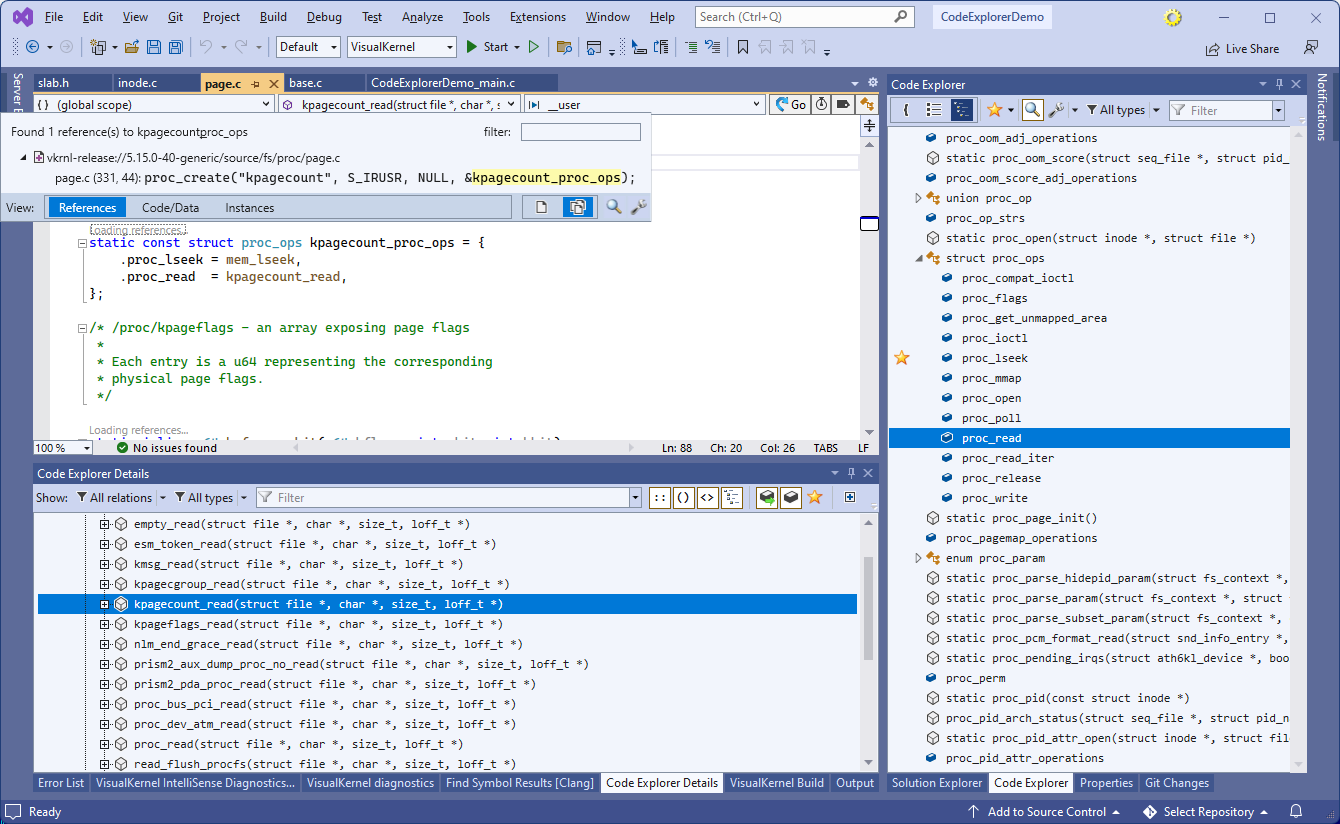
- Similarly, you can navigate the “Implementing functions” view of proc_ops::proc_lseek to find existing implementations in the kernel. E.g. locate and navigate to kpagecount_read(), then use Code Jumps to find where it is assigned:
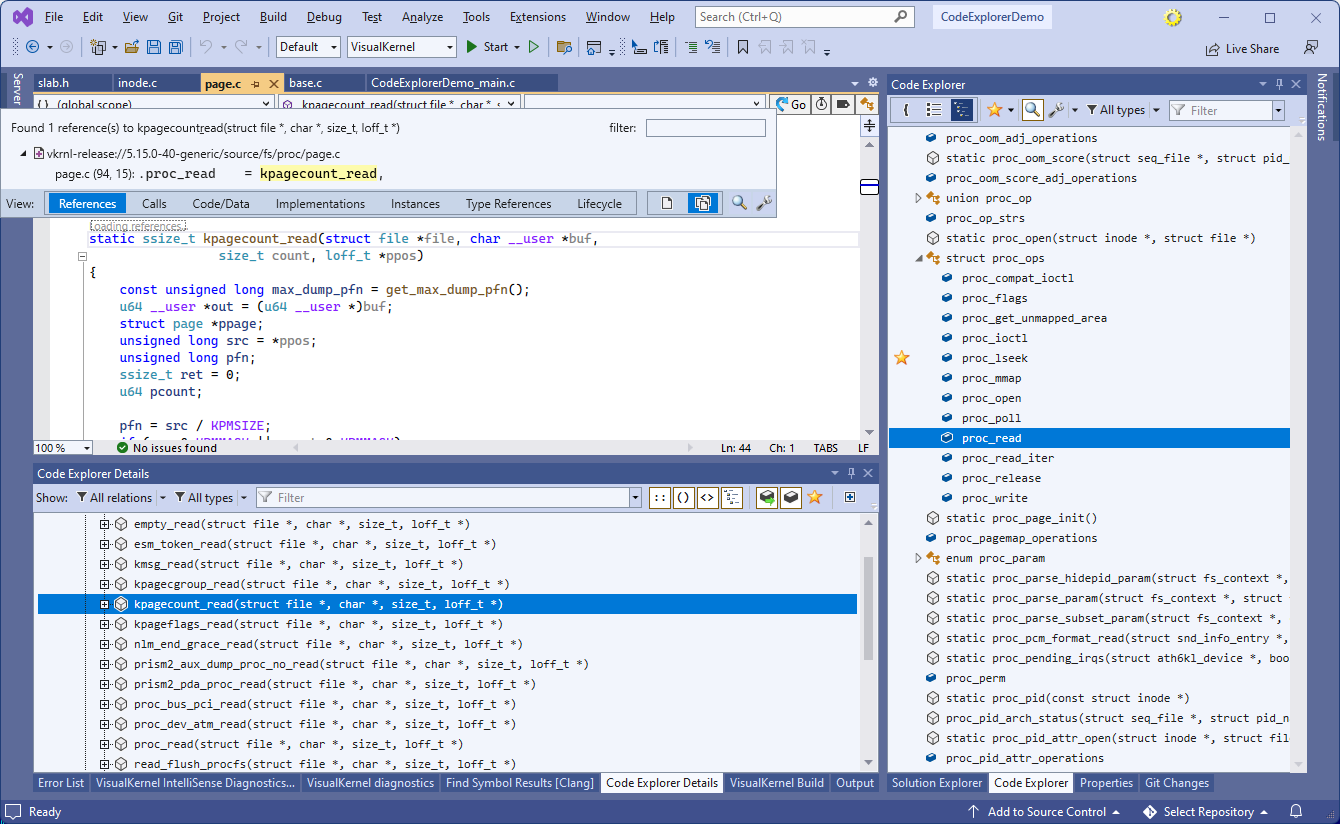
- Use Code Jumps again to quickly find out that it’s used by the /proc/kpagecount file:
- You can set a breakpoint in kpagecount_read() and try running “sudo cat /proc/kpagecount” to make sure the function gets invoked. VisualKernel will let you step through that function as if it was a part of your own project:

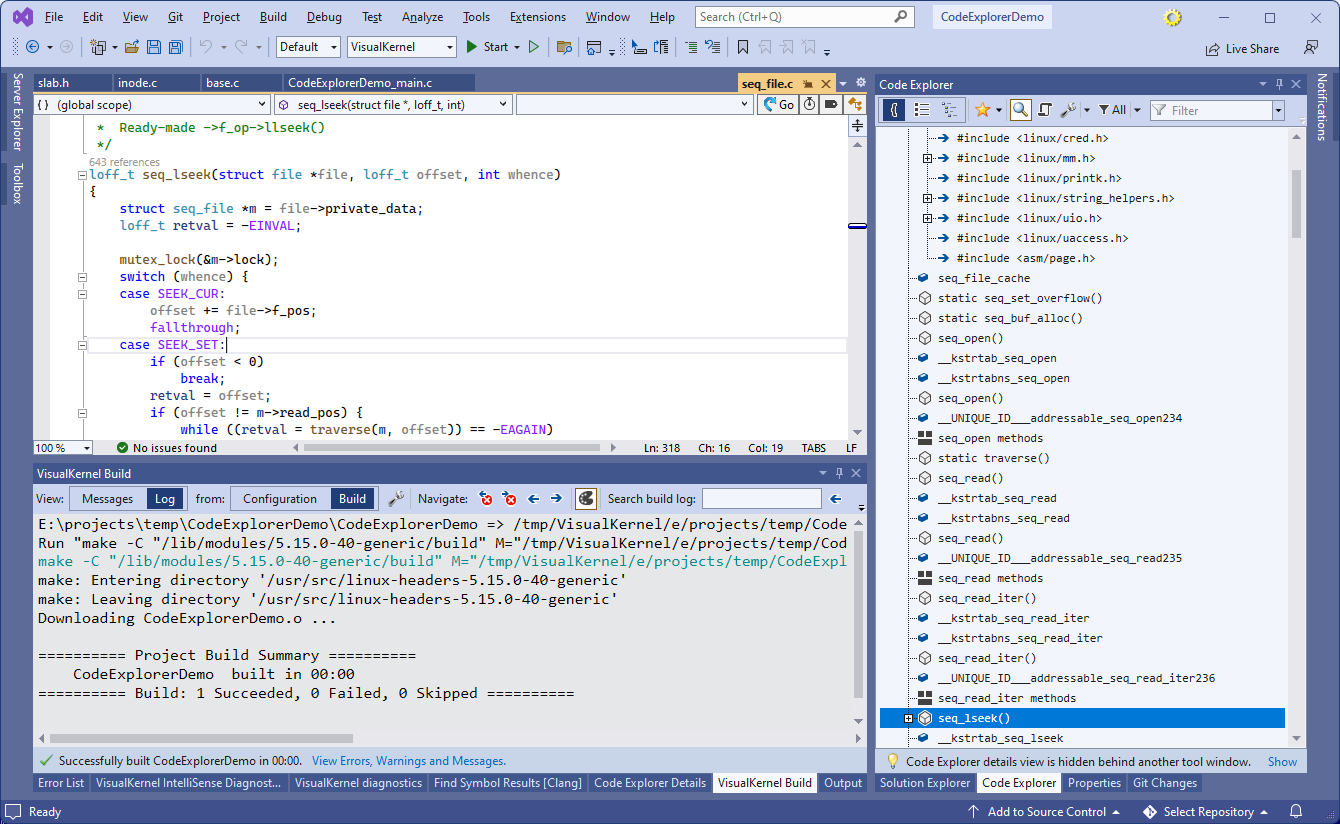
- You can also use Code Explorer to quickly navigate within large files. Go to the implementation of the seq_lseek() function and take a note of the huge size of seq_lseek.c file:
 You can get a good overview of the file structure by switching the Code Explorer to the outline mode and selecting the desired level of detail. In this example, Code Explorer shows the additional variables created by the EXPORT_SYMBOL() macro. In order to hide them, Shift+click on the “Code” checkbox under the type filter, automatically unchecking all other items. Then, disable the “group method implementations” checkbox and enable the display of blocks inside functions:
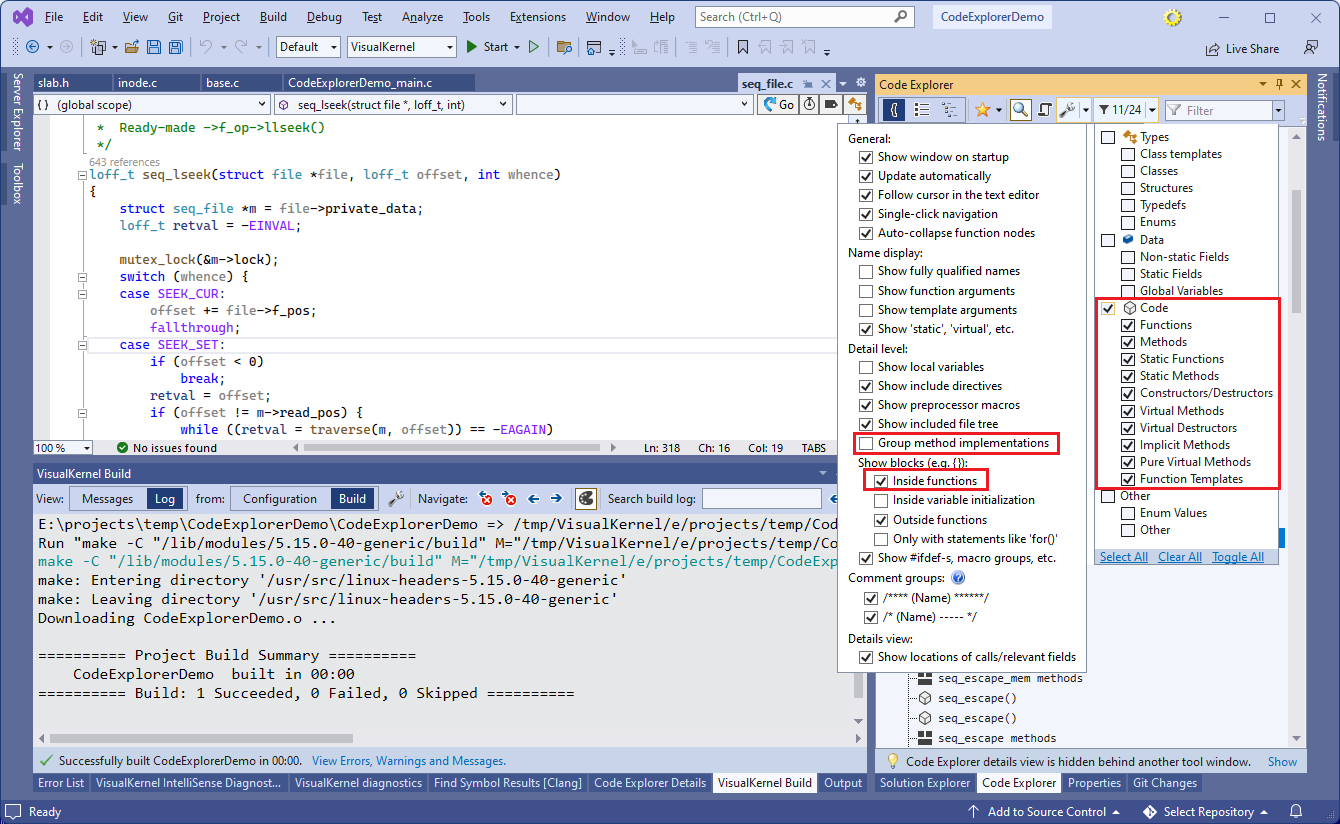
- You can now conveniently view all functions defined in this file, and even see the basic outline of their contents (e.g. if/while blocks):
