Developing Projects for Renesas RA Devices with CodeVROOM
This tutorial shows how to target the Renesas RA devices using CodeVROOM. We will rely on the Renesas Smart Configurator to create a project, and will then use CodeVROOM to do advanced live debugging of the project.
This tutorial shows running CodeVROOM on Linux, however the same will work on Windows and MacOS.
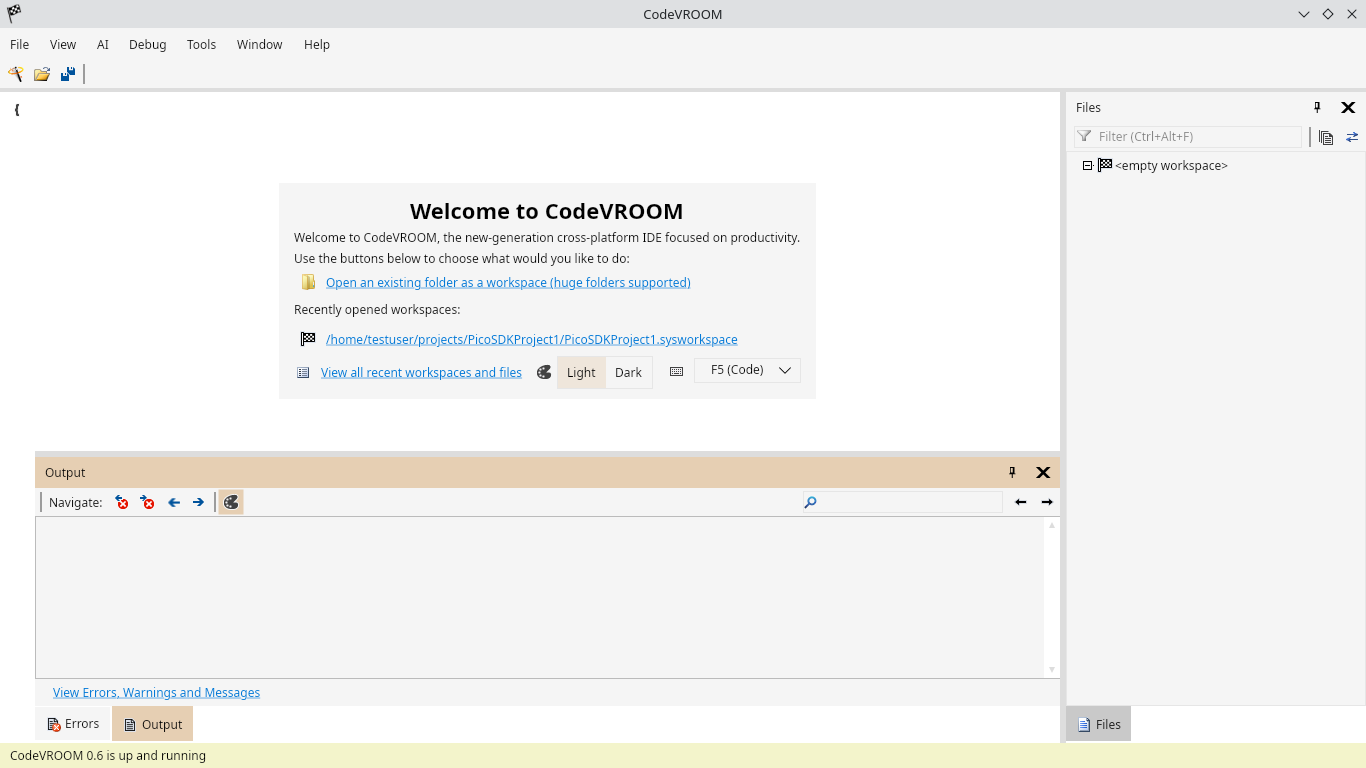
- Start CodeVROOM. If you previously created other projects with it, they will appear in the welcome screen. Otherwise, click File->New->Project to begin creating a new one from scratch:
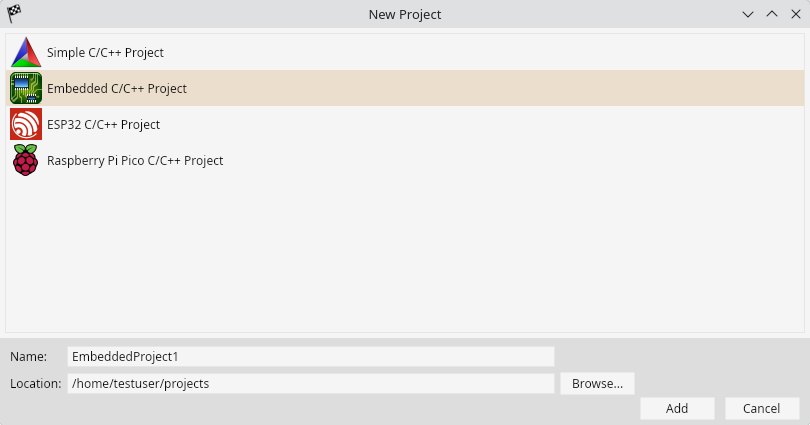
- Select the Embedded Project Wizard in the wizard list and click “Add”:
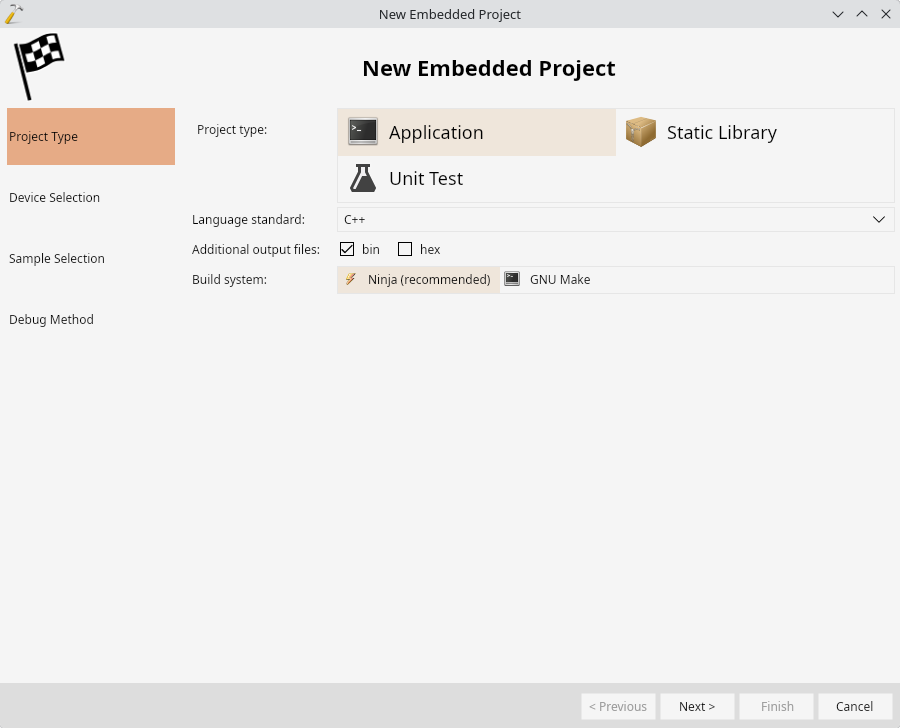
- Proceed with the default settings on the first page of the wizard:
- On the next page, select the default ARM toolchain, then click”Smart Configurators” and pick the Renesas Smart Configurator:
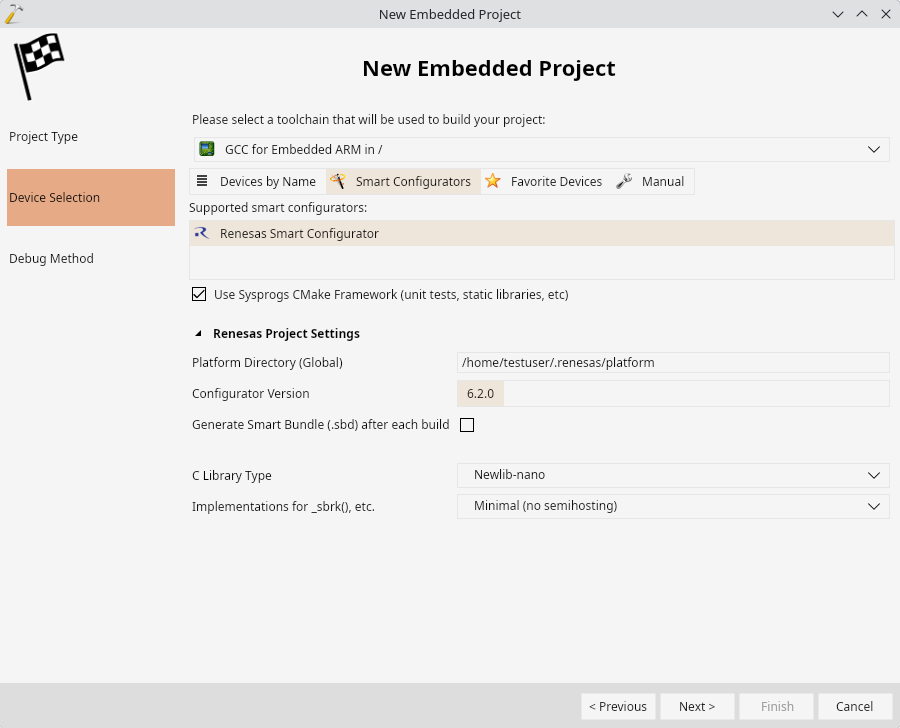
- This will launch the Renesas configurator in the same way as the Renesas VS Code extension does. The first page will ask to confirm the project location:
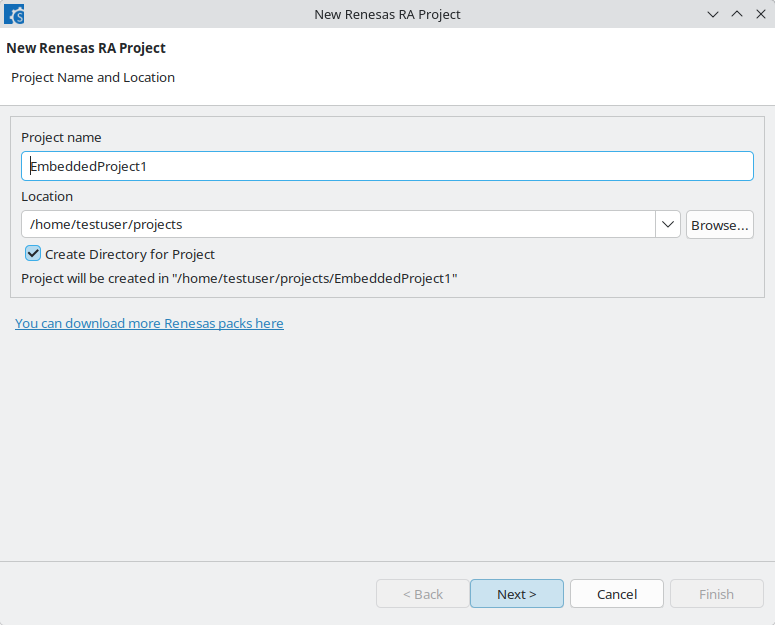 Do not change it, or CodeVROOM won’t be able to find the created project!
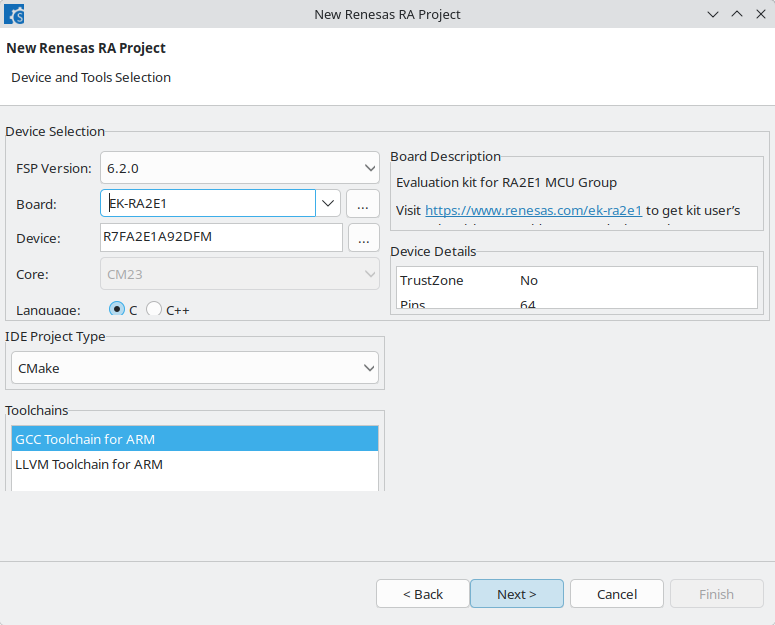
 - The next page will ask for the device type. Select it and click “Next”:
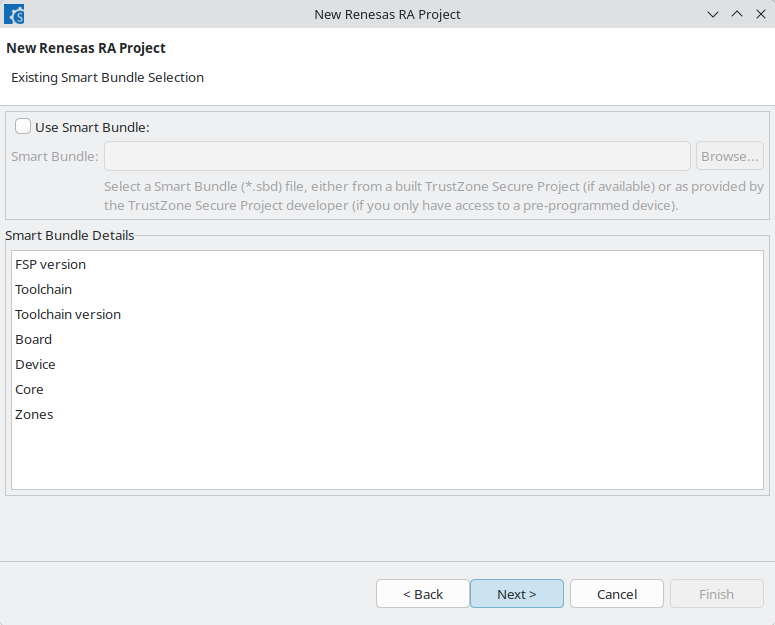
- Proceed with the default Smart Bundle settings:
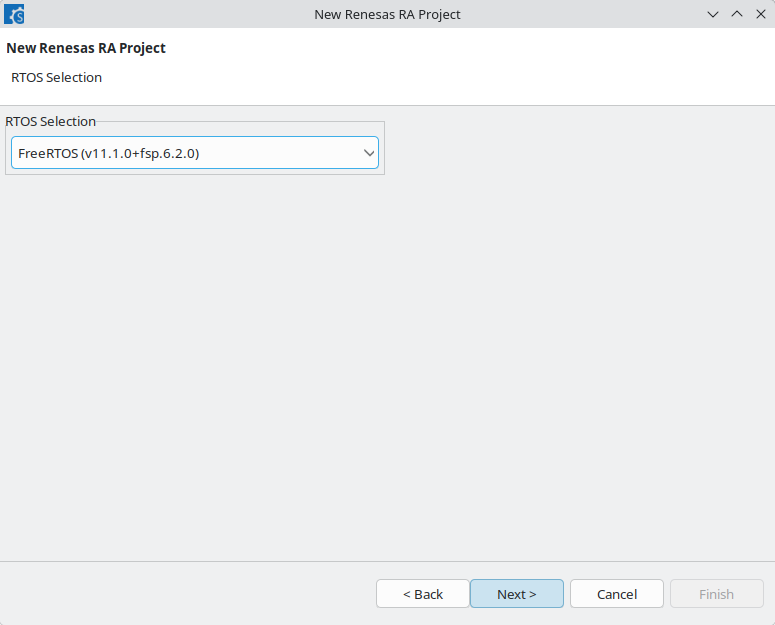
- Select the FreeRTOS as the operating system for the project:
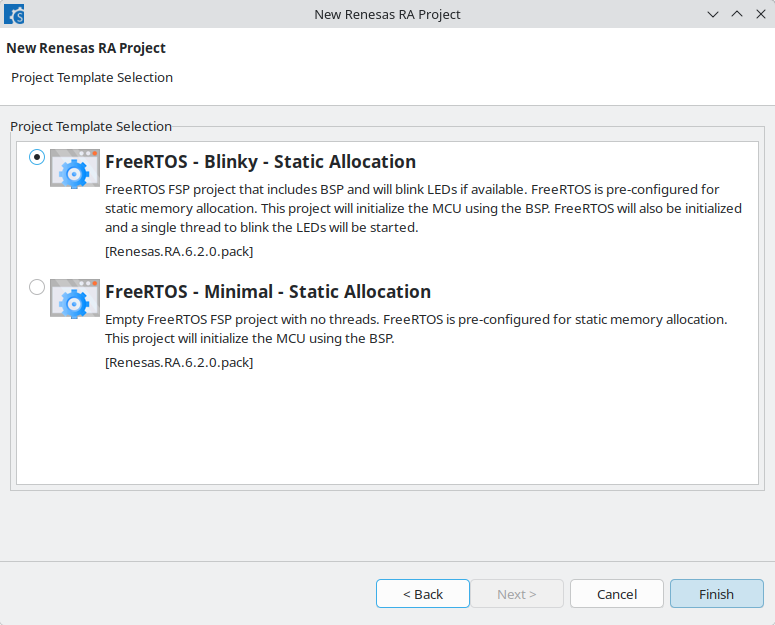
- Finally, proceed with the FreeRTOS Blinky sample:
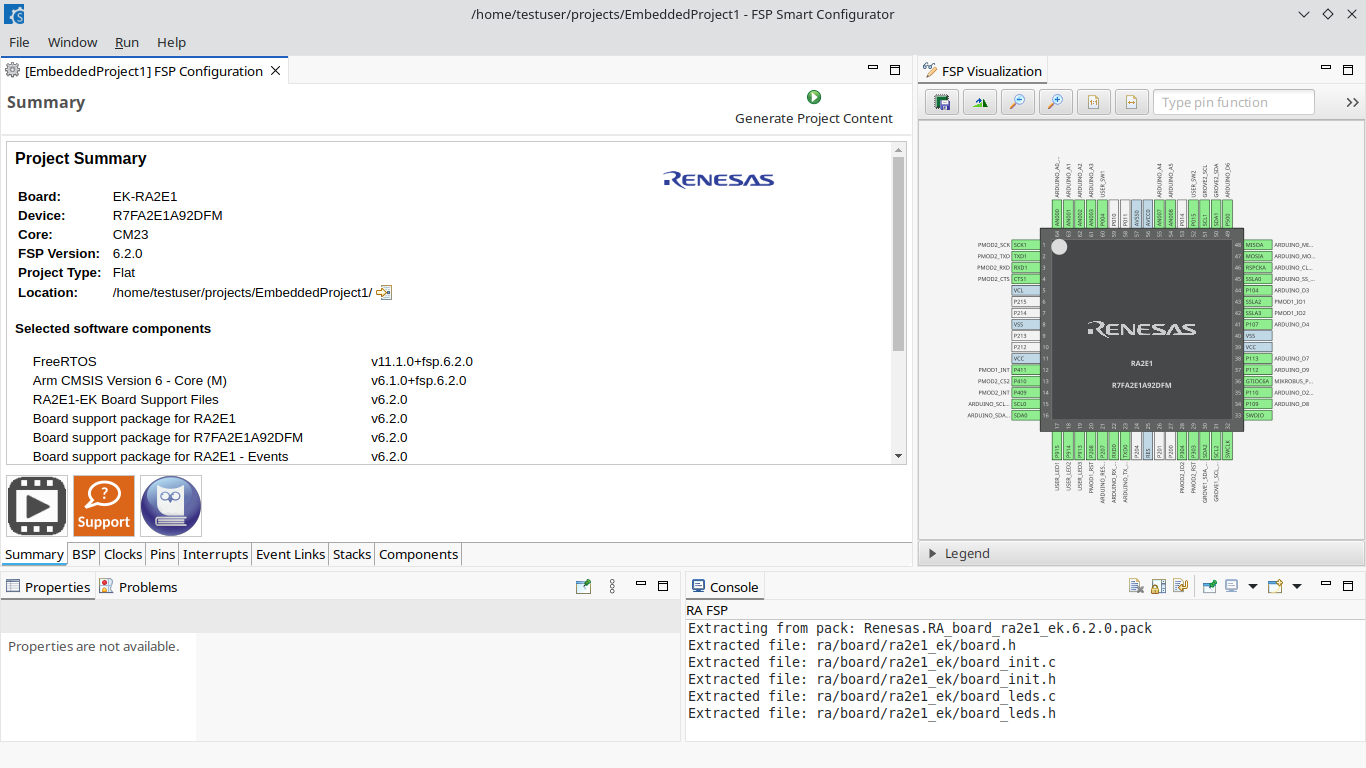
- Renesas Smart Configurator will now show the project summary. Click “Generate Project Content” and close it:
- CodeVROOM will automatically pick up the project structure and will allow configuring the debug settings. Make sure you have the J-Link software installed, then the default settings should work just fine:
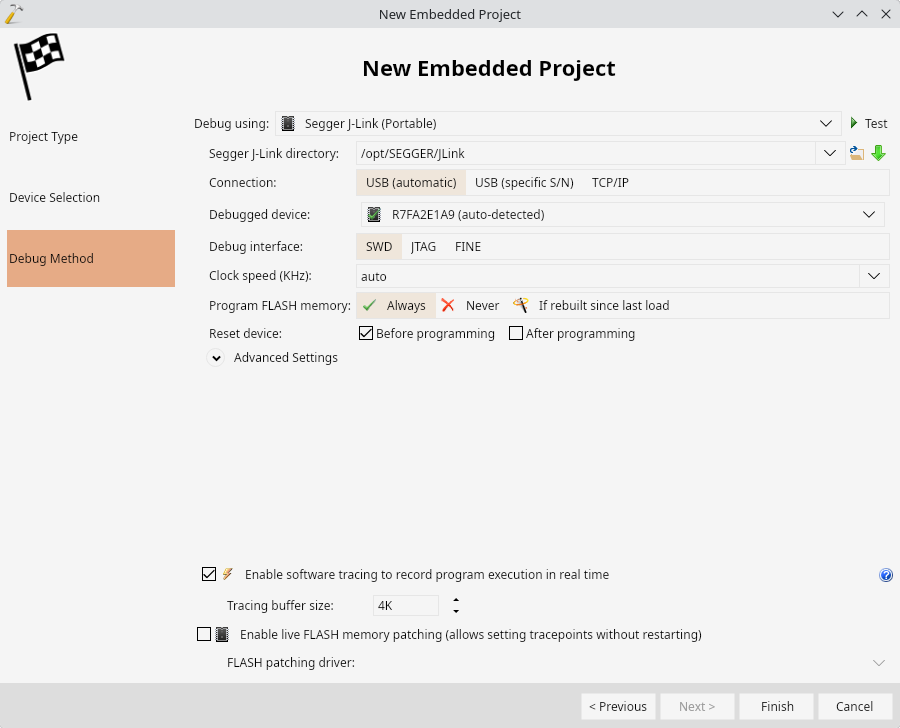
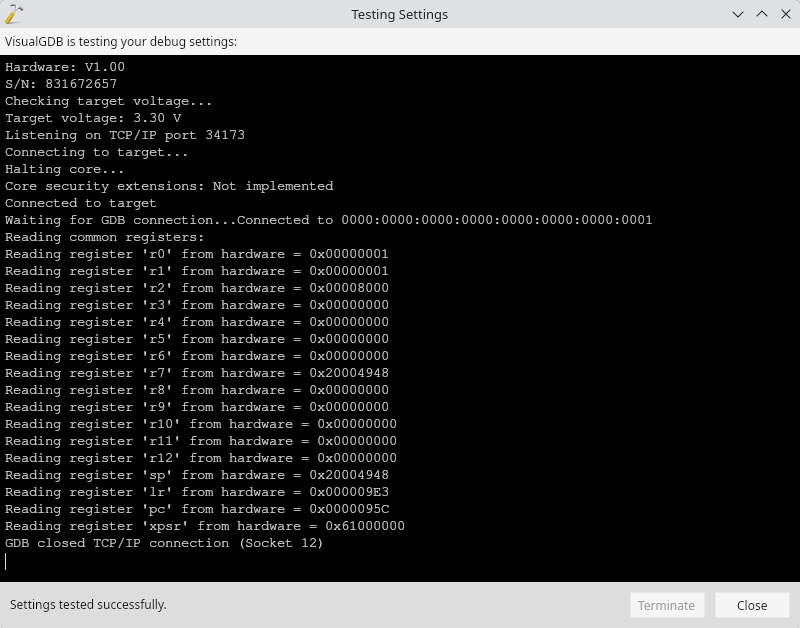
- Use the Test button to verify that J-Link can connect to the target:
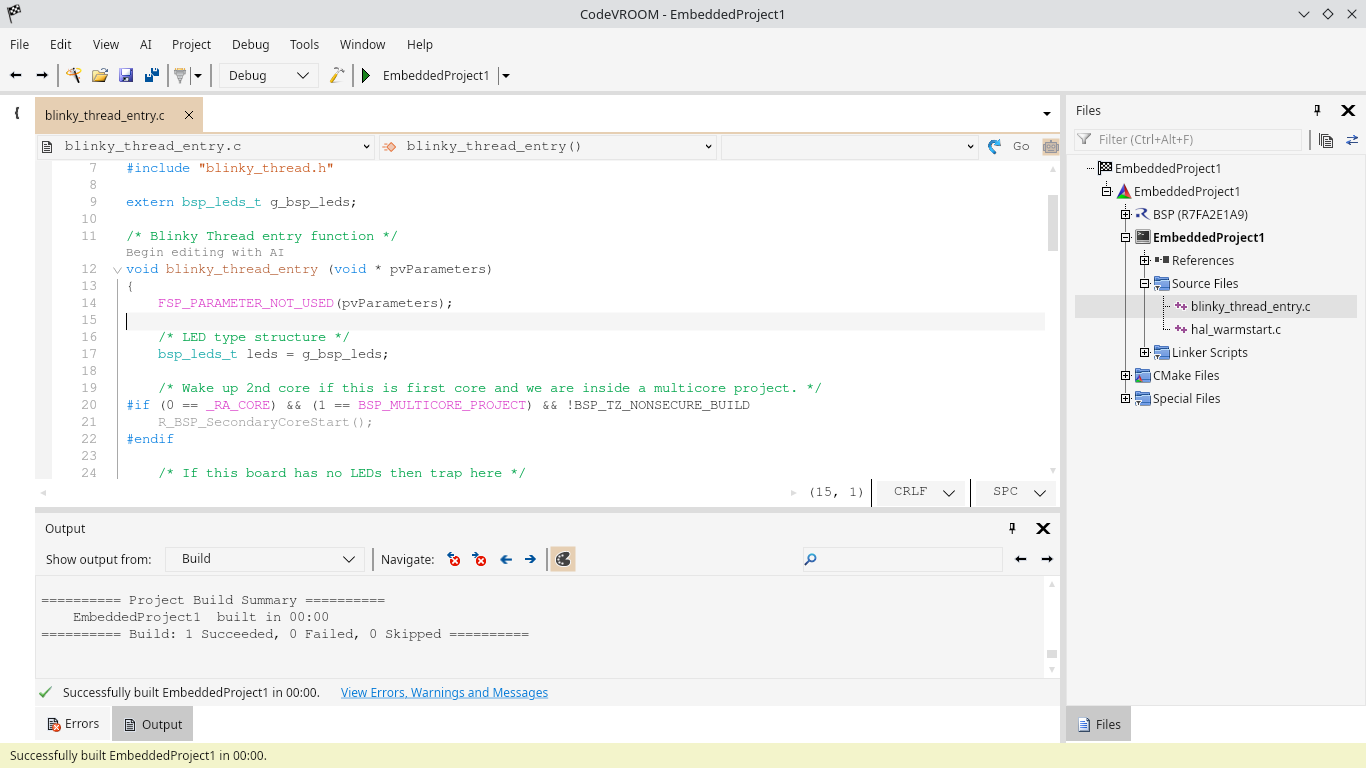
- Press “Finish” to generate the project. You can now build it:
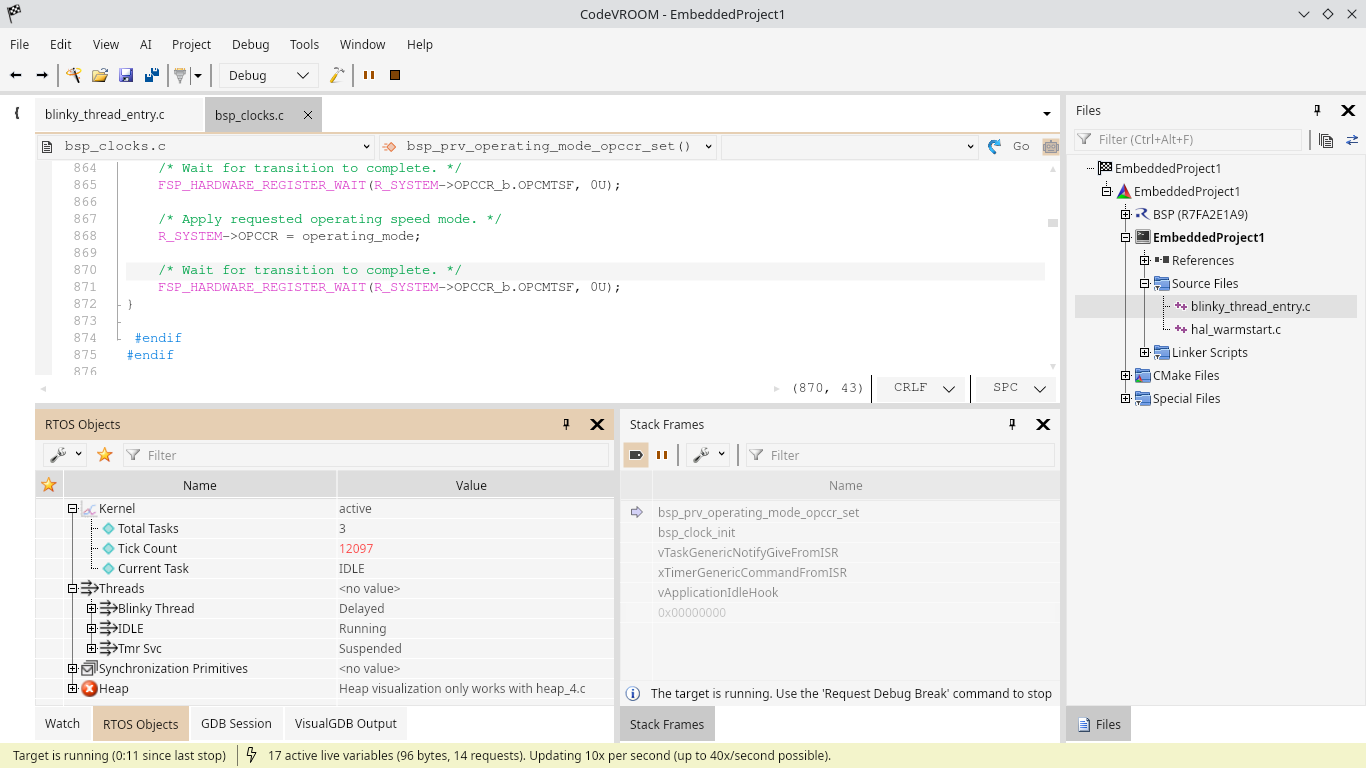
- Press F5 to start debugging. Then open the Debug->Windows->RTOS Objects view. CodeVROOM will analyze and display the FreeRTOS state (e.g. running threads) in real time without stopping the target:
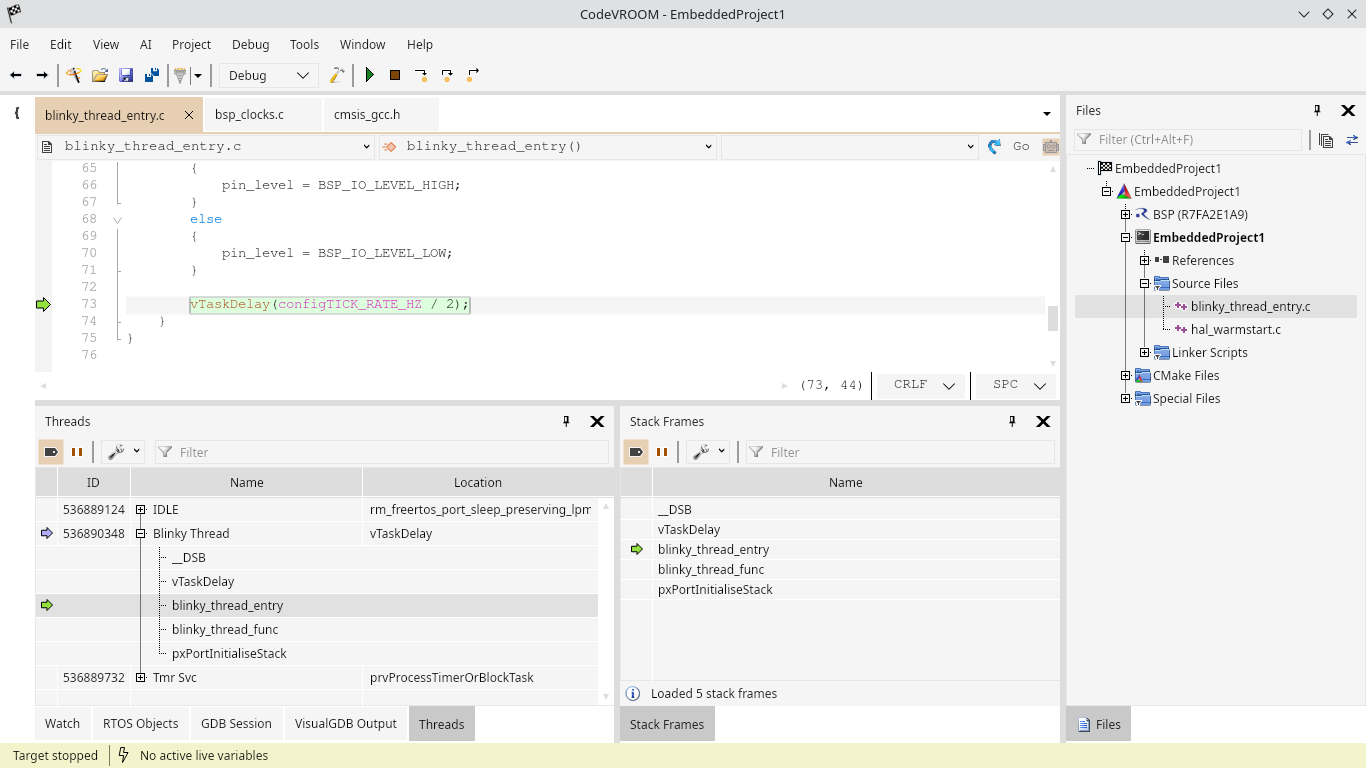
- You can use the Debug->Break command to stop the target and explore the threads and stacks:
- Now we will use the live watch to observe the pin level and iteration count without stopping the target. First of all, move both of these variables to global scope:
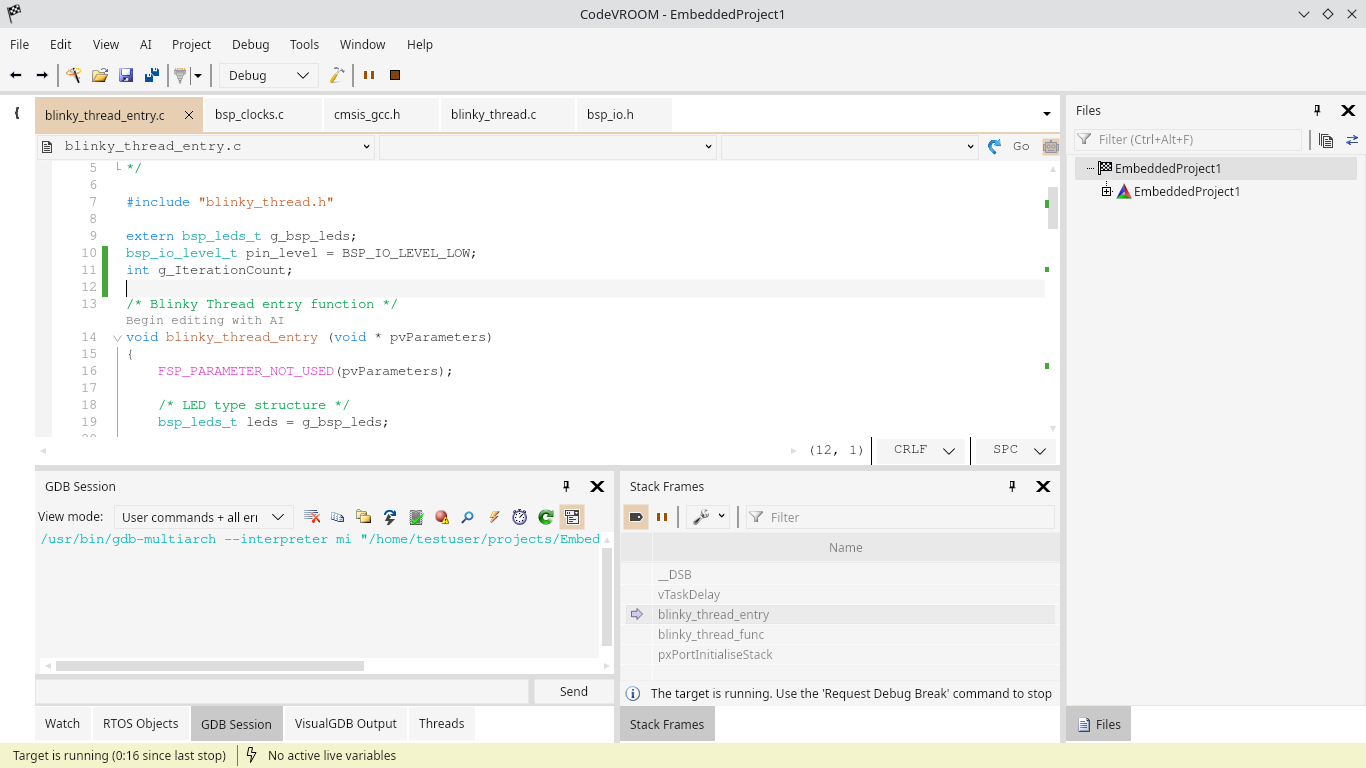
- If you start debugging the project now, you can hover the mouse over g_Iterations and click the graph button to observe the value in real time:
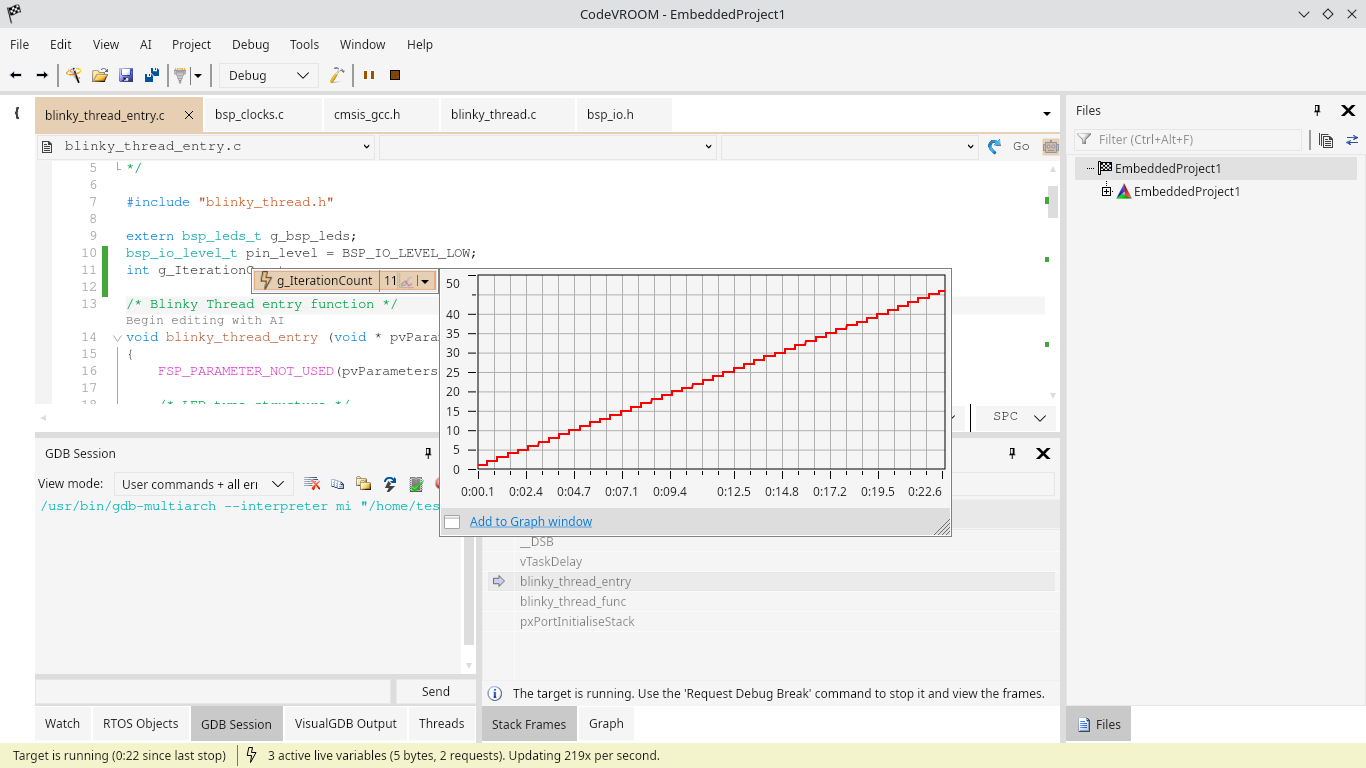
- To view both of them in the same graph, right-click on the value and select “Add to Graph”:
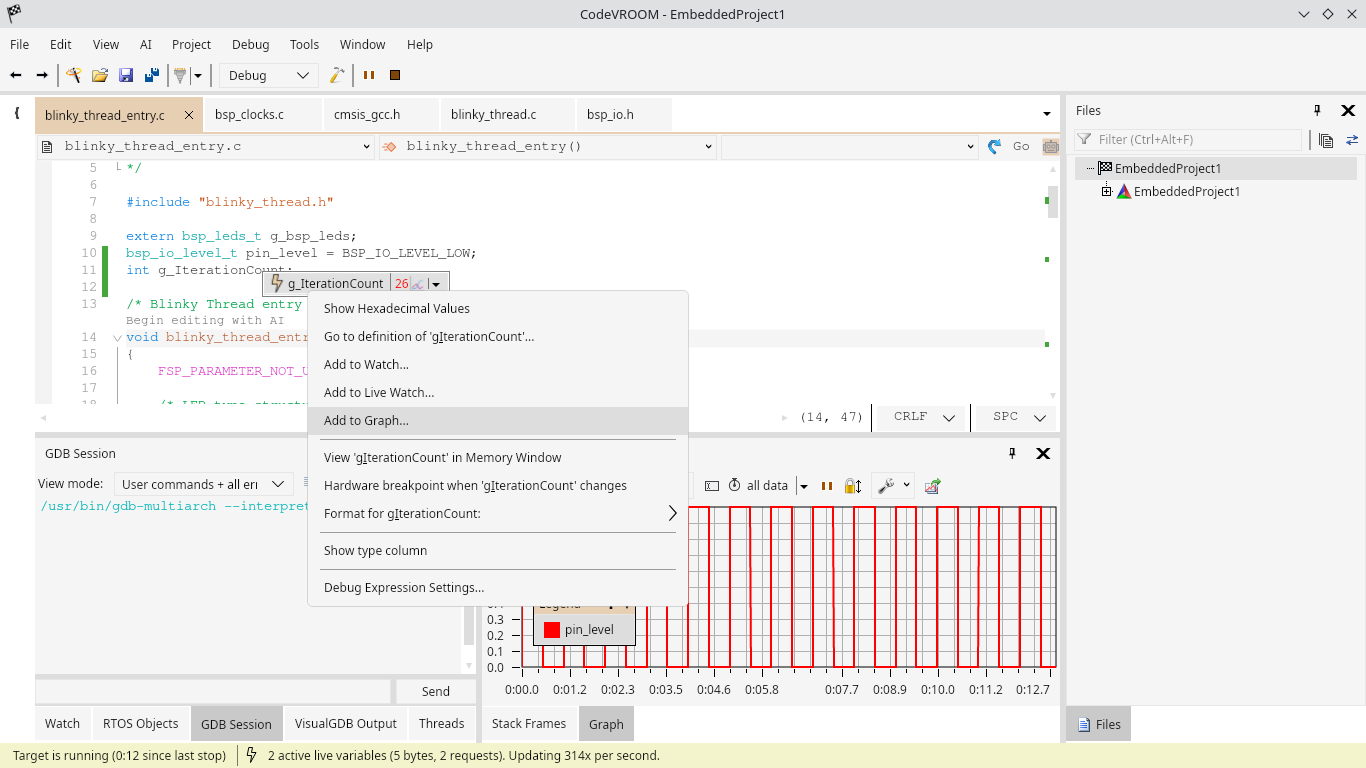
- As iteration count quickly outgrows pin_level, viewing them together can get tricky. To fix this, right-click on either variable in the legend, and move it to a separate band:
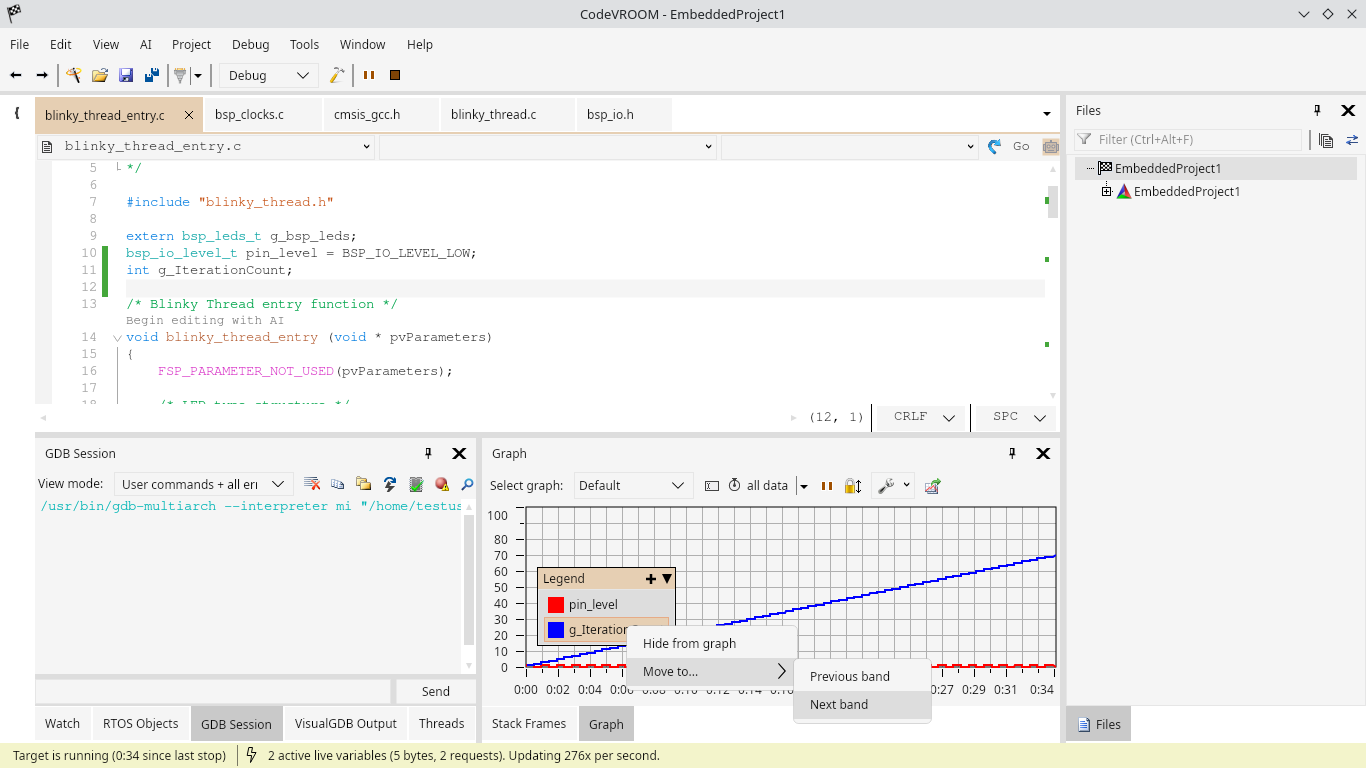
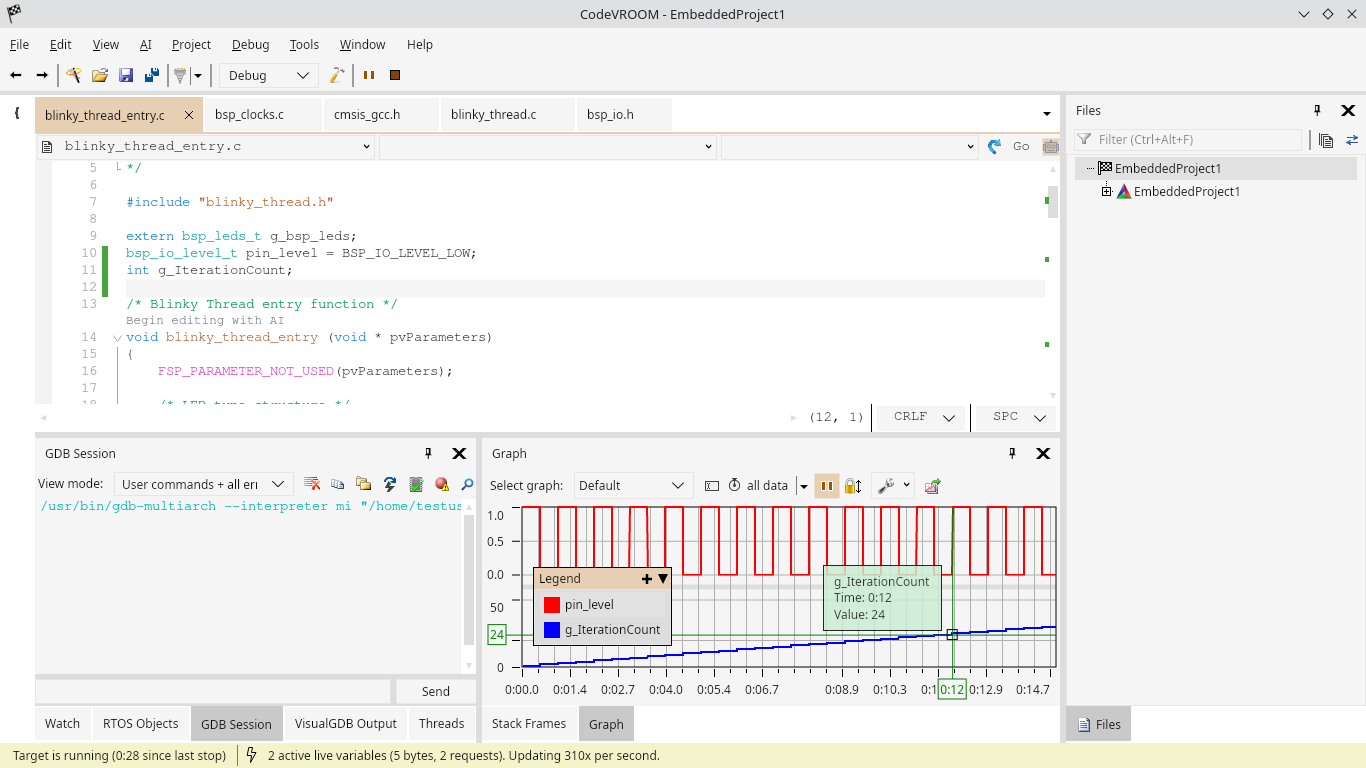
- Now the variables appear side-by-side, so you can zoom into various parts of the plot and explore the values:
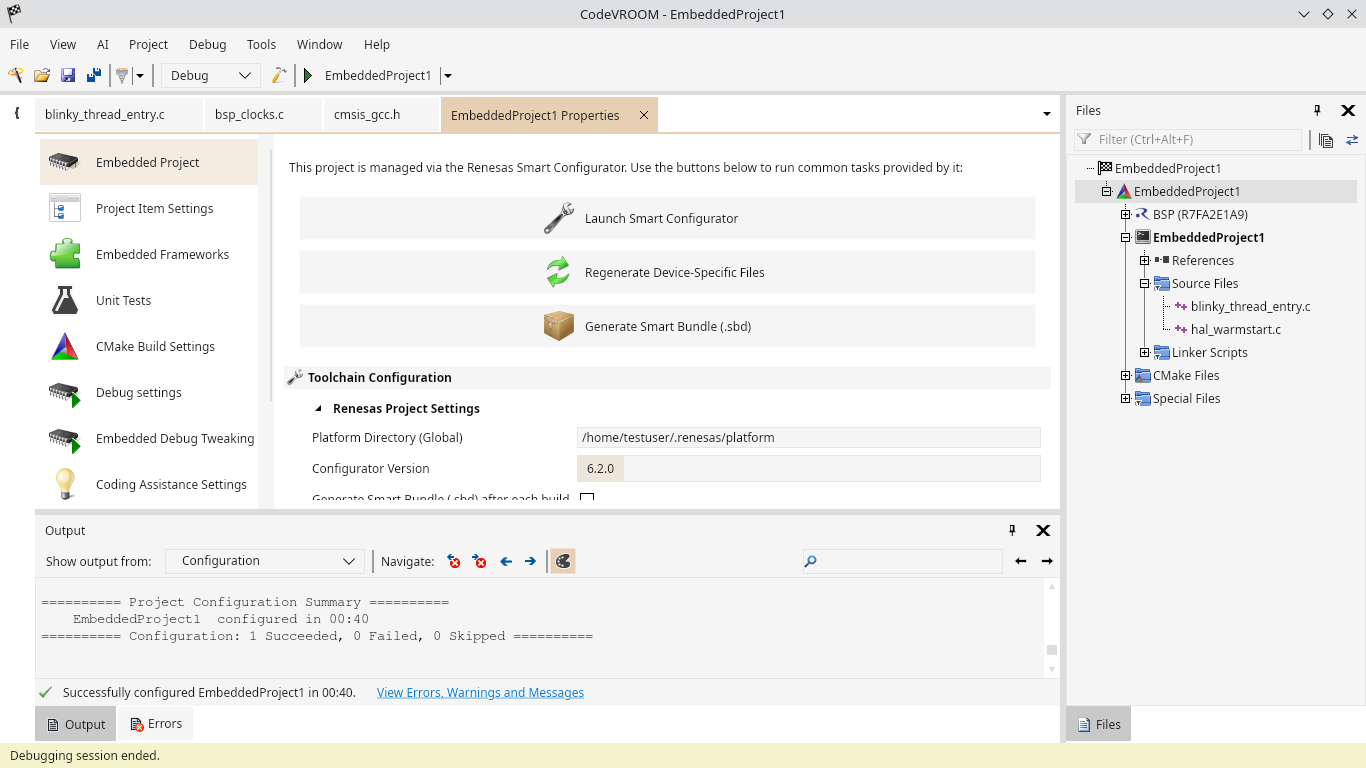
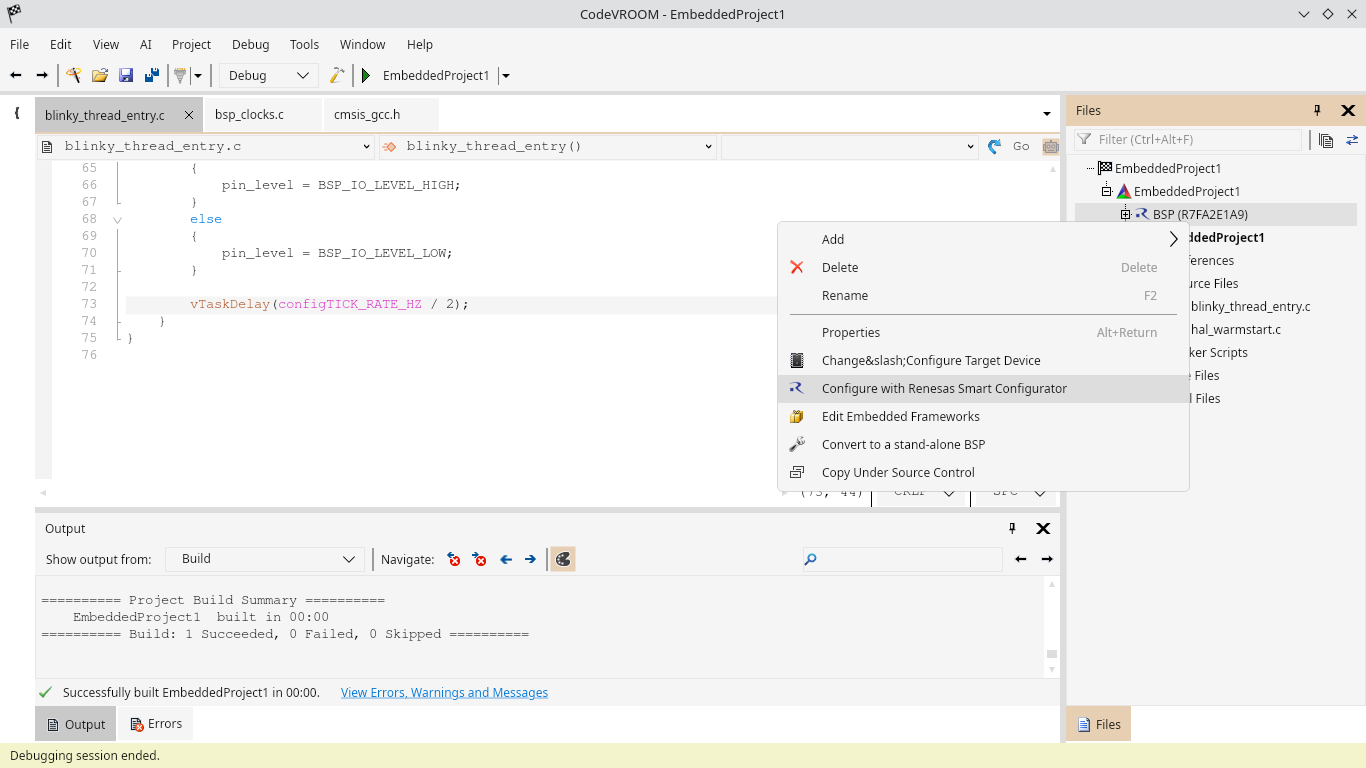
- If you need to change the project configuration, you can easily launch the Renesas configurator from the context menu:
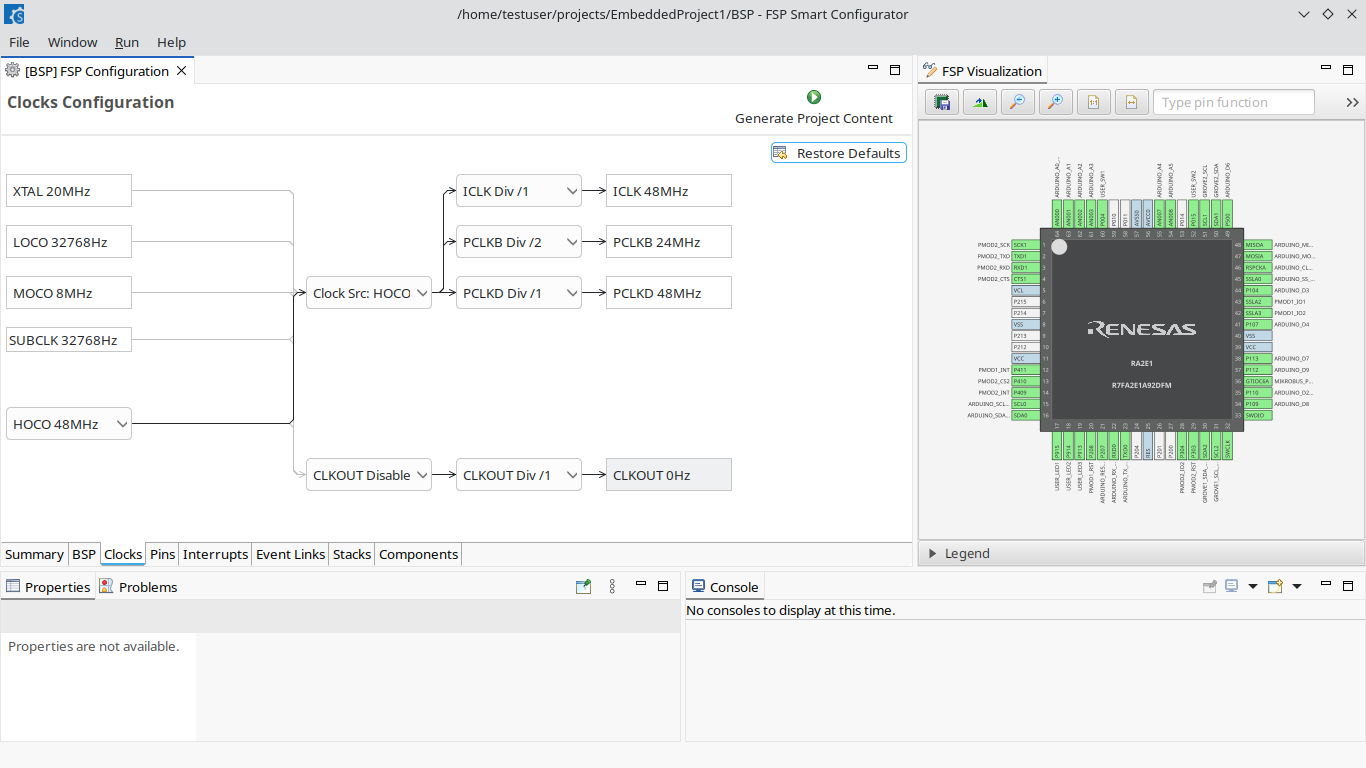
- E.g. you can change clocks, regenerate the project, and get back to CodeVROOM for debugging:
- You can edit various other project properties via the Properties context menu. Most of the settings GUI got directly ported from VisualGDB, so you will find them familiar if you used it before: