Developing ESP32 Projects on Linux with CodeVROOM
This tutorial shows how to create, build and debug a basic ESP32 project on Linux using CodeVROOM (a cross-platform port of VisualGDB). Same steps will also work if you are using Windows or MacOS.
Before you begin, download the latest version of CodeVROOM here. You can then either install it, or run directly in the portable mode.
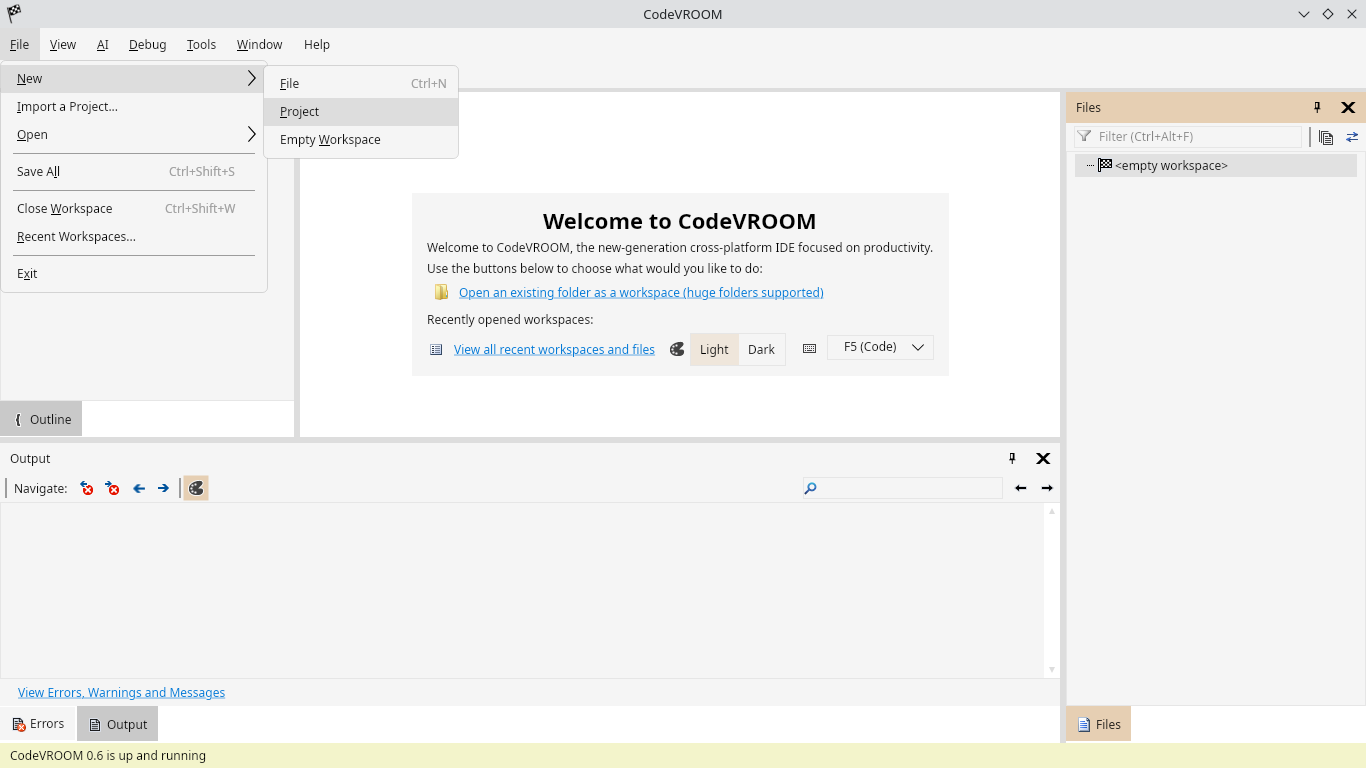
- Start CodeVROOM and select File->New->Project to begin creating a project:
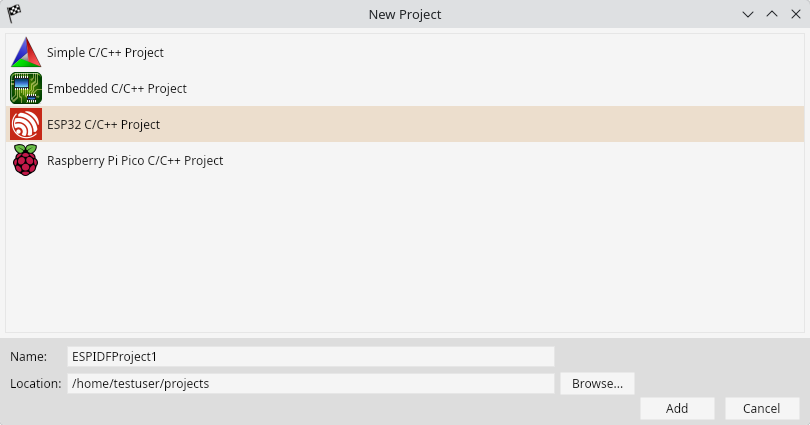
- Pick the ESP32 project wizard:
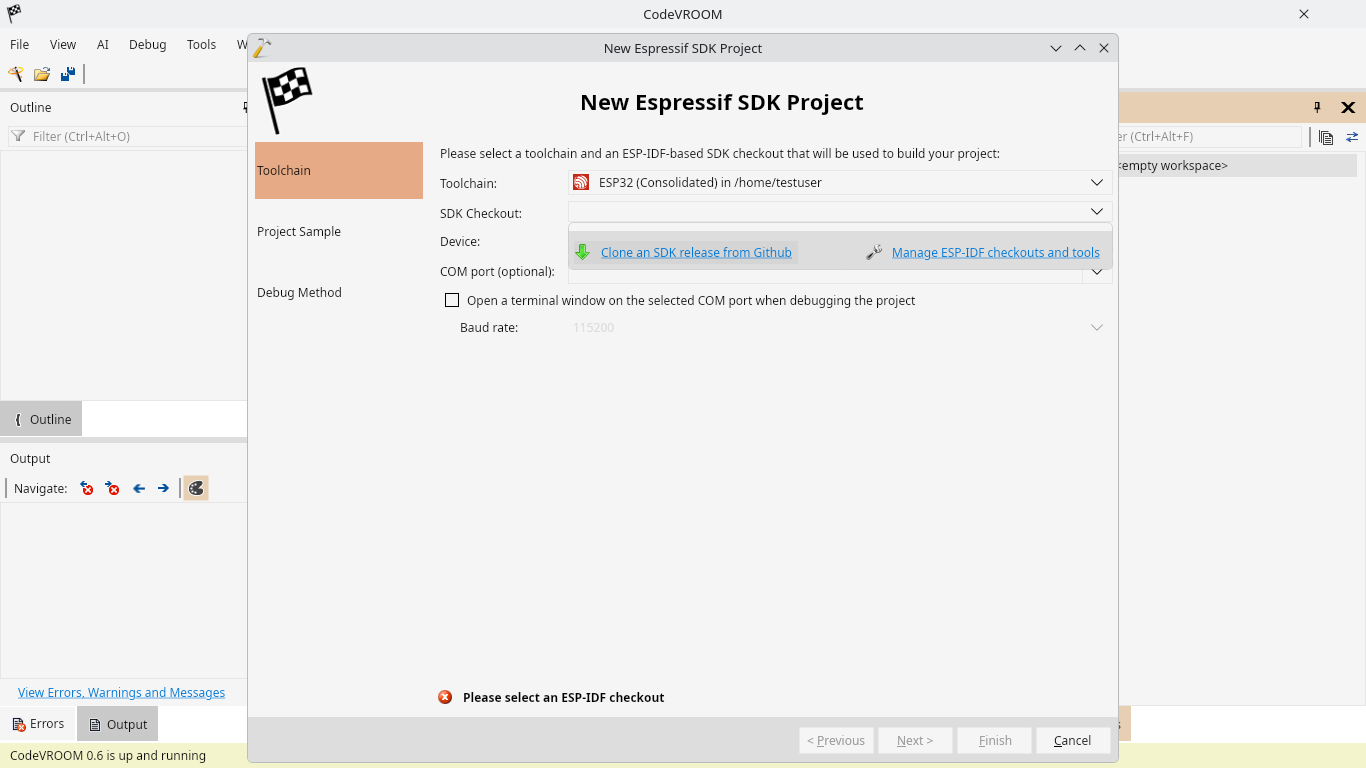
- The first wizard page allows selecting the toolchain and ESP-IDF version. CodeVROOM can reuse the ESP-IDF installations from the Espressif’s VS Code extension, but it can also install the tools from scratch. Click “Clone an SDK release from Github” to install a new SDK:
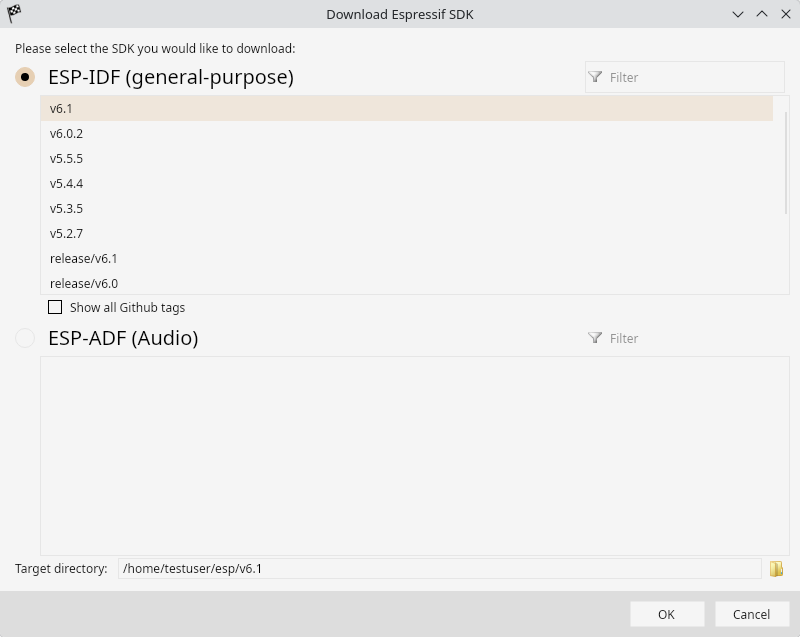
- Select the ESP-IDF version you would like to use and click “OK”:
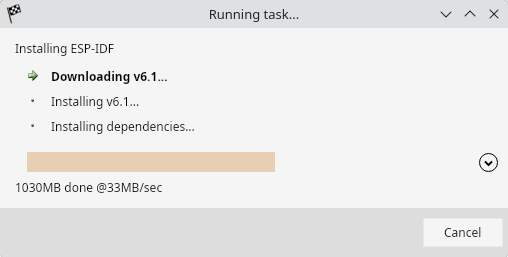
- CodeVROOM will automatically clone the SDK and download the necessary tool dependencies:
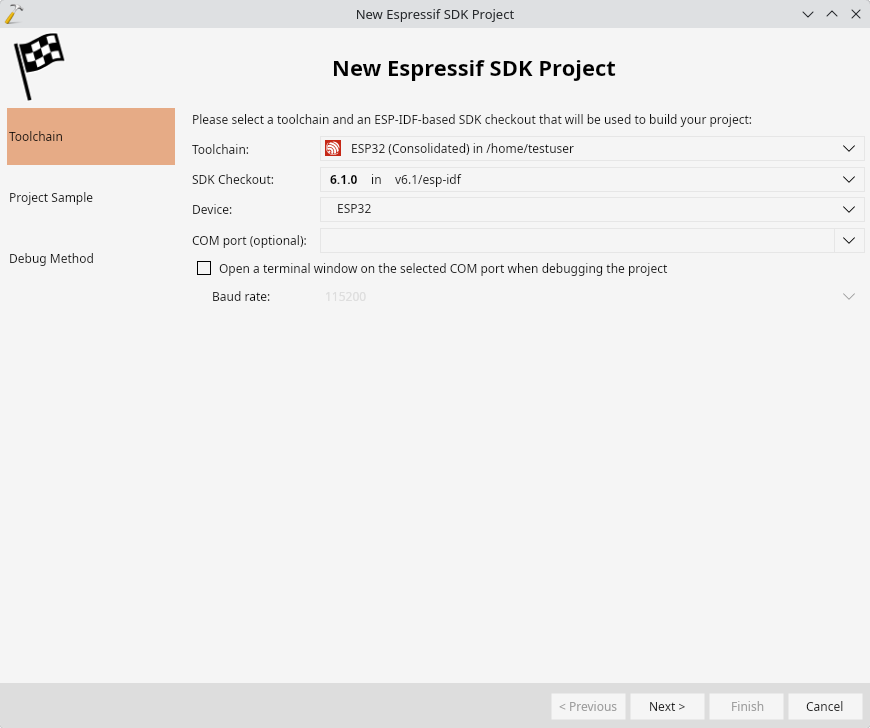
- Once the installation is completed, the ESP-IDF checkout will appear in the selector. Make sure you have selected the correct device and click “Next”:
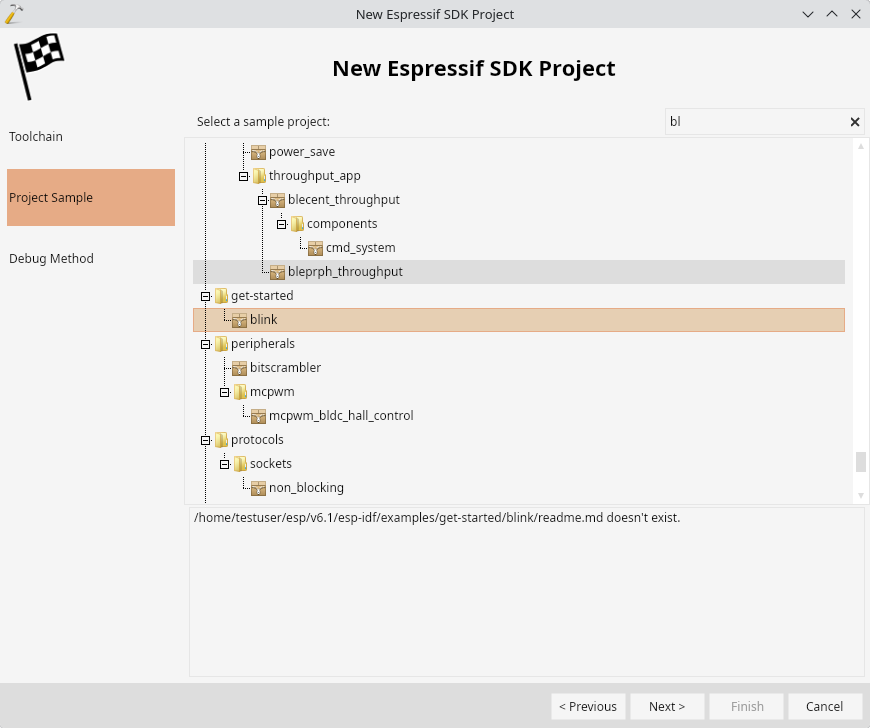
- Select the sample project you would like to clone:
- The final page of the wizard allows configuring the debug settings. It automatically shows the OpenOCD scripts for the target and interface, and allows quickly running OpenOCD to test the configuration:
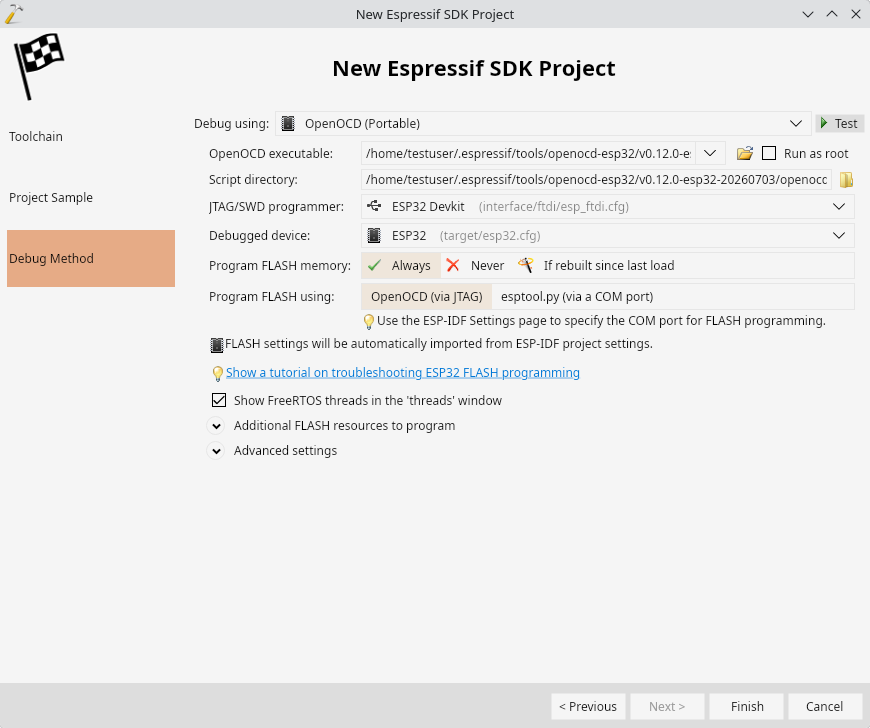
- Click “Test” to ensure that OpenOCD can connect to the board:
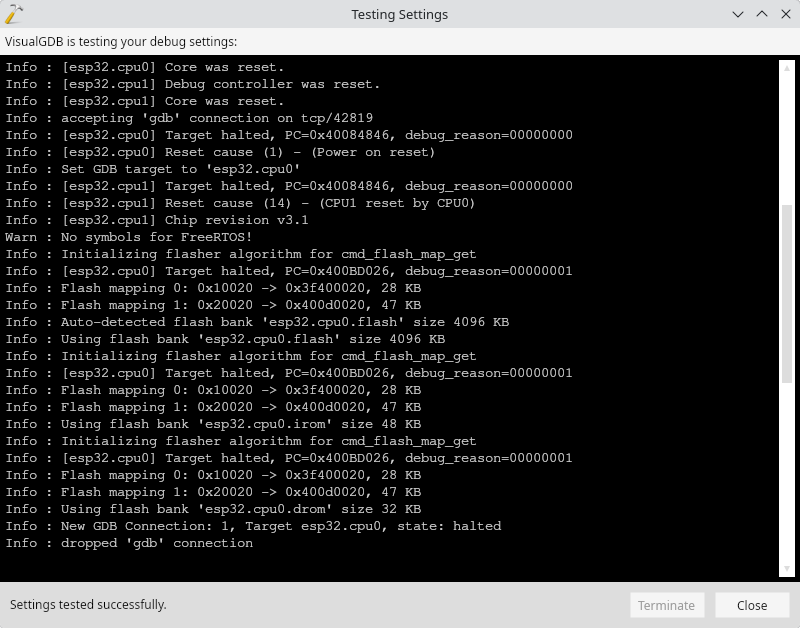
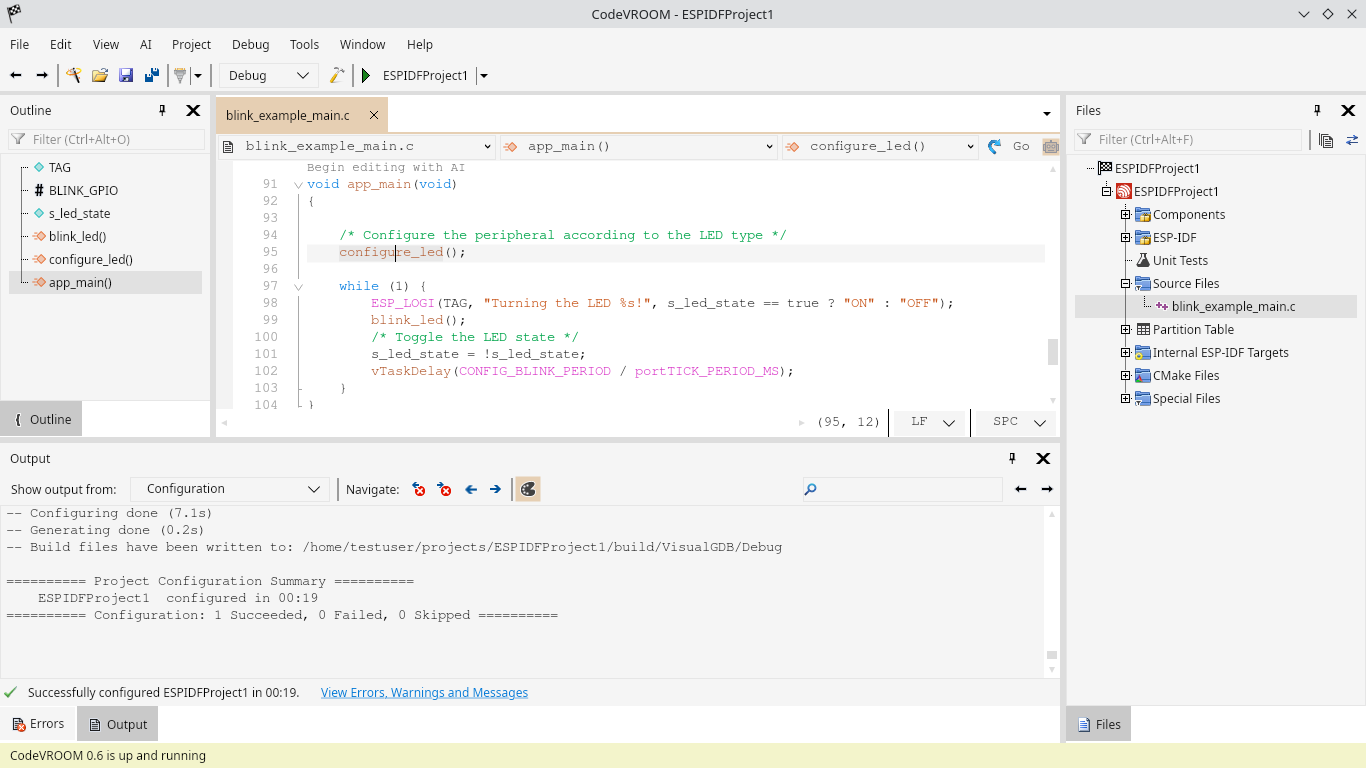
- Press “Finish” to create the project. Once it is loaded, you will see a project layout similar to VisualGDB:
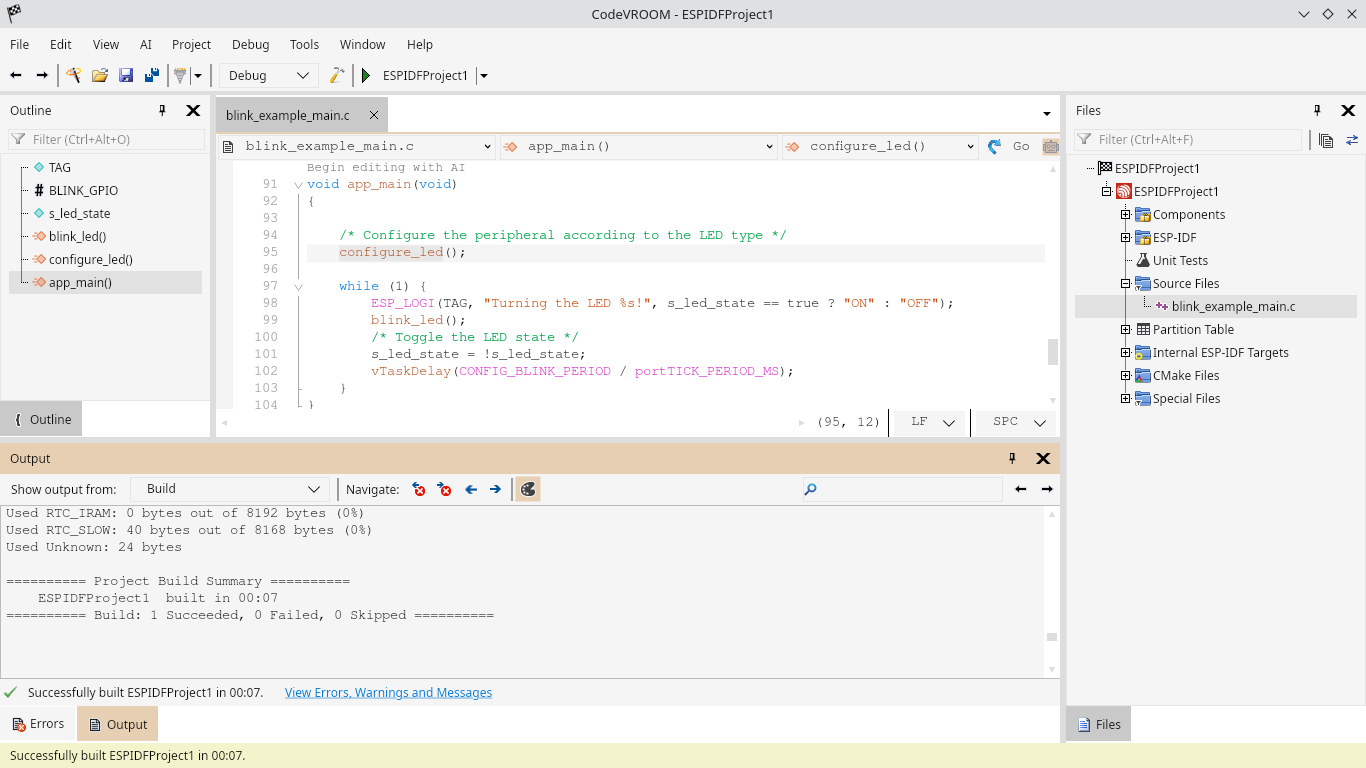
- Build the project. ESP-IDF projects involve many small files, so the build on Linux generally takes much less time compared to Windows:
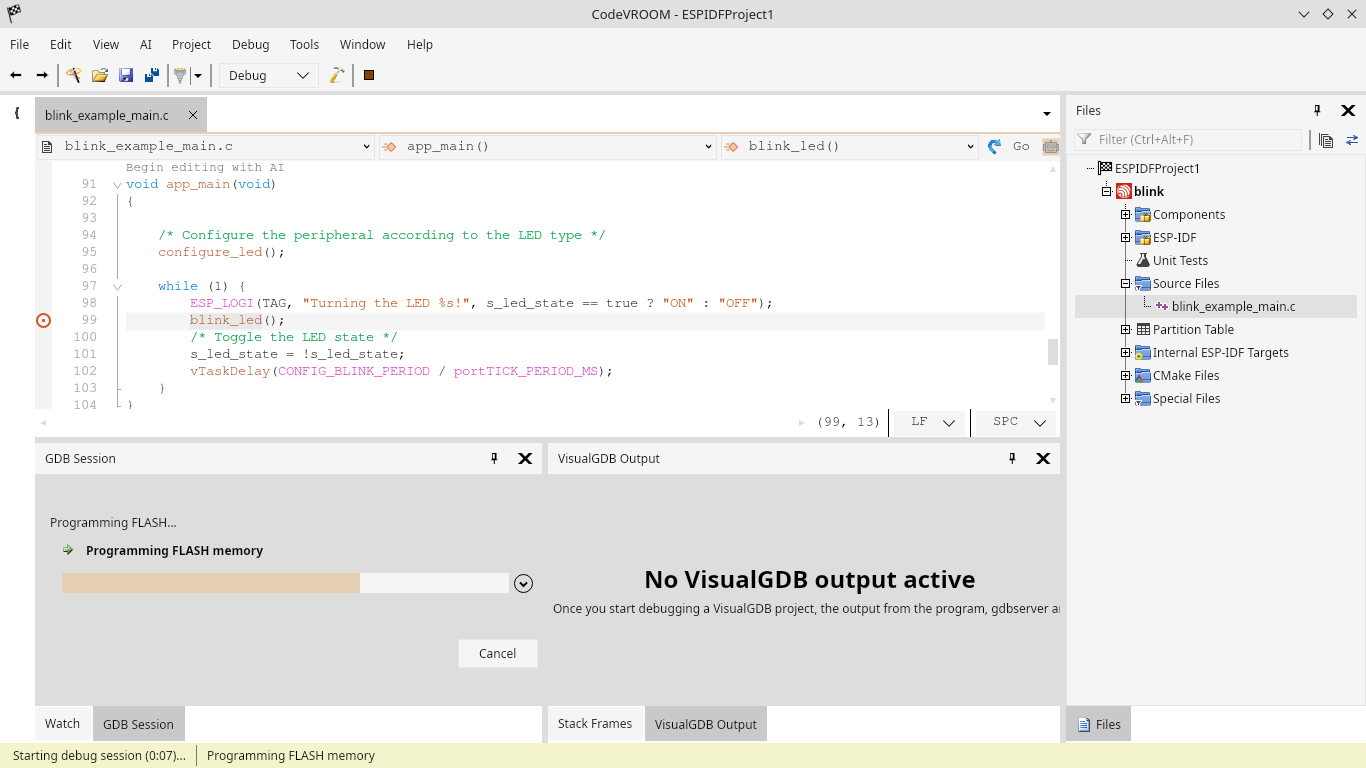
- Set a breakpoint in app_main() and use the toolbar or the keyboard shortcut to start debugging. CodeVROOM will automatically program the FLASH memory using the Espressif’s OpenOCD fork:
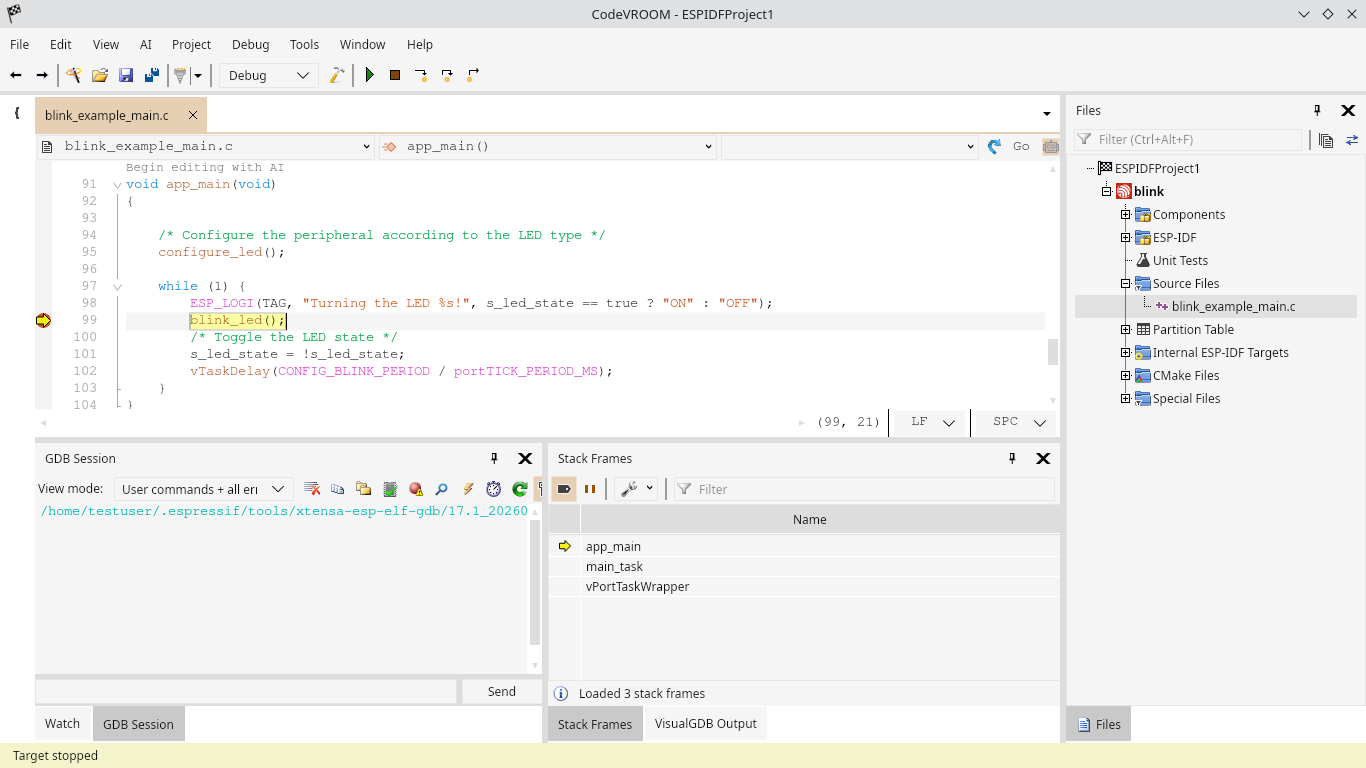
- Once the program is loaded, the breakpoint will hit. You can use the Stack Frames window to see what function called app_main():
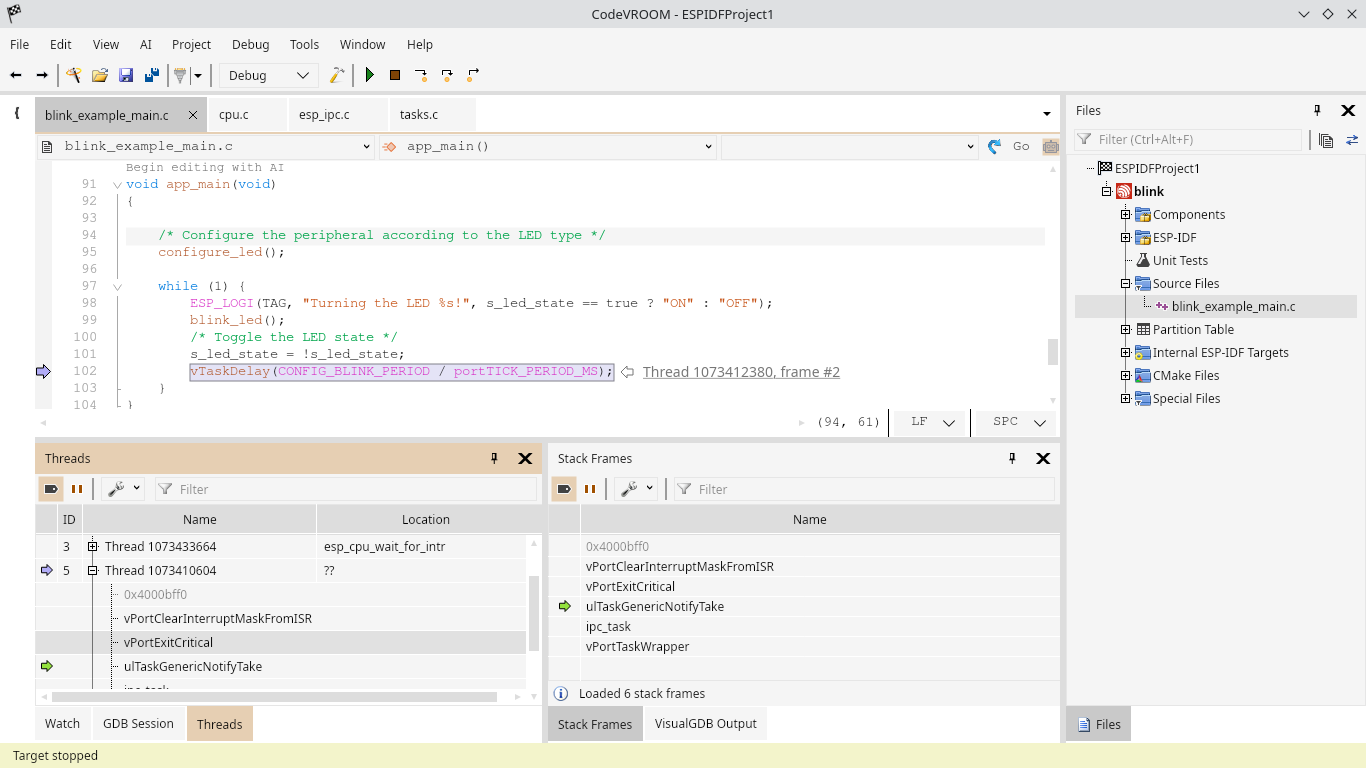
- Use the Debug->Windows->Threads window to view all threads, and their stack frames. Note that if you stop the program at an arbitrary point, CodeVROOM will highlight the locations of all threads in code. You can then click the link next to each highlighted line to switch to that thread and view its local variables:
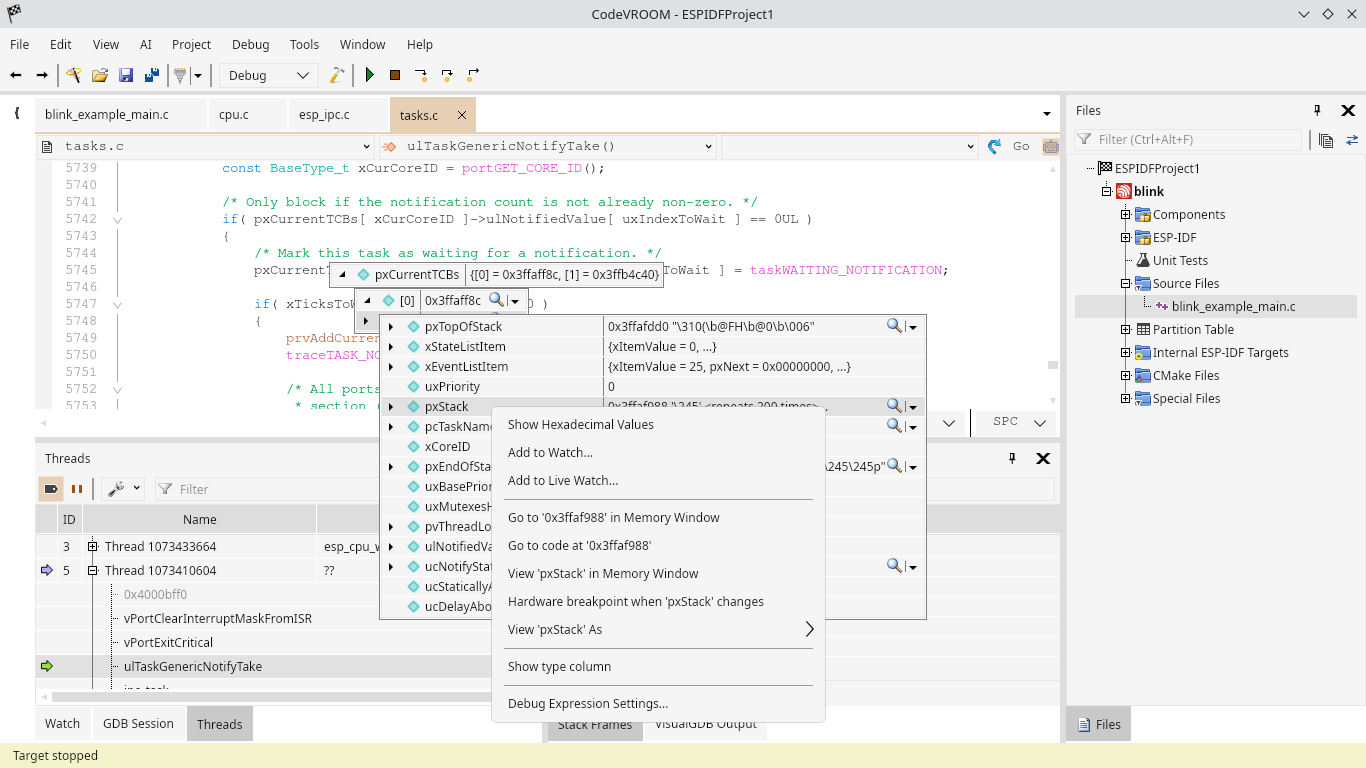
- You can hover the mouse over various variables in the code, or use the Watch windows to observe them. Use the context menu to quickly jump to additional debugging windows (e.g. memory):
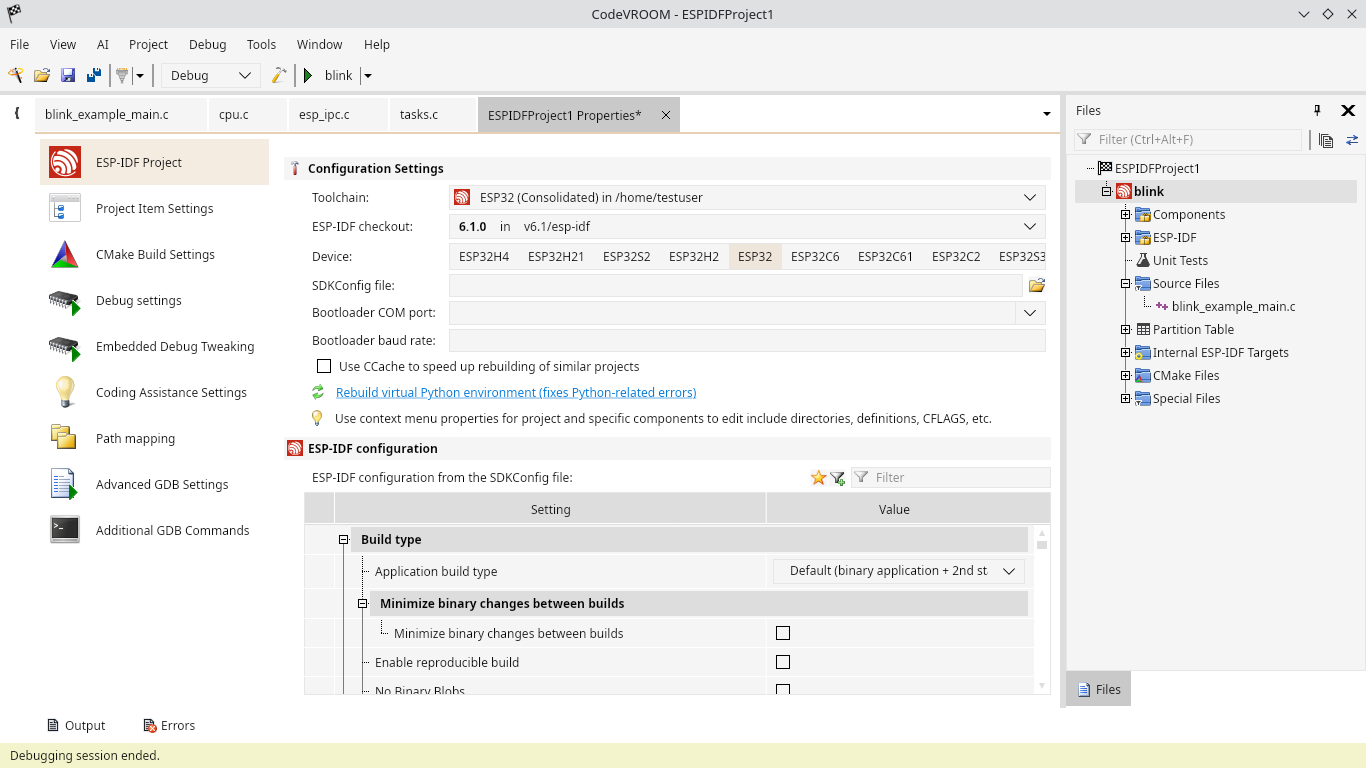
- Similarly to VisualGDB, you can edit various project properties via the Properties command in the Files window. E.g. the ESP-IDF configuration variables will be shown as a searchable tree: